Carnegie Stage Comparison
| Embryology - 28 Jul 2026 |
|---|
| Google Translate - select your language from the list shown below (this will open a new external page) |
|
العربية | català | 中文 | 中國傳統的 | français | Deutsche | עִברִית | हिंदी | bahasa Indonesia | italiano | 日本語 | 한국어 | မြန်မာ | Pilipino | Polskie | português | ਪੰਜਾਬੀ ਦੇ | Română | русский | Español | Swahili | Svensk | ไทย | Türkçe | اردو | ייִדיש | Tiếng Việt These external translations are automated and may not be accurate. (More? About Translations) |
Introduction
Stages are based on the external and/or internal morphological development of the vertebrate embryo, and are not directly dependent on either age or size. The human embryonic period proper is divided into 23 Carnegie stages. Criteria beyond morphological features include age in days, number of somites present, and embryonic length.
As this staging can be applied to all vertebrates, and most vertebrate embryos develop during the embryonic period in much the same way, we can directly compare the timing of development for different species.
From the table you can see that to reach the end of embryonic development, Carnegie stage 23, can take from as little as 10 days in chickens to nearly 60 days in humans. Carnegie is the name of a historical US Institute that historically categorised these developmental stages.
Please note that these species comparisons are approximate only with some variations found in the scientific literature. There was also a 1954 paper comparing human and mouse stages.[1]
- Links: Embryonic Development | Carnegie Stage Comparison | Carnegie Institution - Contributions to Embryology | Human Embryo Collections
- Carnegie Stages: 1 | 2 | 3 | 4 | 5 | 6 | 7 | 8 | 9 | 10 | 11 | 12 | 13 | 14 | 15 | 16 | 17 | 18 | 19 | 20 | 21 | 22 | 23 | About Stages | Timeline
Species Comparison of Carnegie Stages

Data For Carnegie Stages Comparison Graph (Species/Days)
| Species | Stage | |||||||||||||||
| Human[2] | Days | 20 | 22 | 24 | 28 | 30 | 33 | 36 | 40 | 42 | 44 | 48 | 52 | 54 | 55 | 58 |
| baboon[3] | Days | 23 | 25 | 27 | 28 | 29 | 30 | 31 | 33 | 35 | 37 | 39 | 41 | 43 | 45 | 47 |
| monkey[4] | Days | 21 | 22 | 25 | 28 | 29 | 30 | 32 | 34 | 36 | 37 | 38 | 40 | 42 | 44 | 46 |
| marmoset[5] | Days | 57 | 60 | 64 | 67 | 74 | ||||||||||
| mouse[6] | Days | 9 | 9.5 | 10 | 10.5 | 11 | 11.5 | 12 | 12.5 | 13 | 13.5 | 14 | 14.5 | 15 | 15.5 | 16 |
| rat[7] | Days | 10.5 | 11 | 11.5 | 12 | 12.5 | 13 | 13.5 | 14 | 14.5 | 15 | 15.5 | 16 | 16.5 | 17 | 17.5 |
| hamster[8] | Days | 10 | 10.5 | 11 | 11.5 | 12 | 12.5 | 13 | 13.5 | 14 | 14.5 | 15 | 15.5 | 16 | 16.5 | 17 |
| guinea pig[9][10] | Days | 14.5 | 15 | 15.5 | 17 | 18 | 19 | 20 | 21 | 22 | 23 | 24 | 25 | 26 | 27 | 29 |
| rabbit[11] | Days | 8 | 8.5 | 9.5 | 10.5 | 11 | 12 | 12.5 | 13.5 | 14 | 14.5 | 15.5 | 16 | 16.5 | 17 | 18 |
| sheep[12] | Days | 15 | 16 | 17.5 | 18.5 | 19.5 | 20.5 | 22 | 23 | 24.5 | 25.5 | 27.5 | 29.5 | 30 | 33 | |
| pig[13] | Days | 14 | 15 | 16 | 17 | 18 | 19 | 20.5 | 21.5 | 23 | 24 | 25.5 | 27.5 | 29 | 30.5 | 32.5 |
| chicken[14] | Days | 1 | 1.5 | 2 | 2.25 | 2.5 | 3 | 3.25 | 3.75 | 4.75 | 5.5 | 6.25 | 7.25 | 7.75 | 8.5 | 10 |
| dog | Days | 27 | 28 | 29 | 30 | 34 | 36 | 37 | ||||||||
| bat[15] | Days | 40 | 44 | 46 | 50 | 54 | 60 | 70 | 80 |
Table References
- ↑ OTIS EM & BRENT R. (1954). Equivalent ages in mouse and human embryos. Anat. Rec. , 120, 33-63. PMID: 13207763
- ↑ O'Rahilly R. (1979). Early human development and the chief sources of information on staged human embryos. Eur. J. Obstet. Gynecol. Reprod. Biol. , 9, 273-80. PMID: 400868
- ↑ Hendrickx Embryology of the baboon. University of Chicago Press.
- ↑ Hendrickx and Sawey Embryology of the rhesus monkey. The Rhesus Monkey, Bourne (ed), Academic Press, NY (1975)
- ↑ Phillips IR. (1976). The embryology of the common marmoset (Callithrix jacchus). Adv Anat Embryol Cell Biol , 52, 3-47. PMID: 827927
- ↑ Theiler K. The House Mouse: Atlas of Mouse Development (1972, 1989) Springer-Verlag, NY. Online
- ↑ Witschi E. Rat Development. In: Growth Including Reproduction and Morphological Development. (1962) Altman PL. and Dittmer DS. ed. Fed. Am. Soc. Exp. Biol., Washington DC, pp. 304-314.
- ↑ ten Donkelaar HJ, Geysberts LG & Dederen PJ. (1979). Stages in the prenatal development of the Chinese hamster (Cricetulus griseus). Anat. Embryol. , 156, 1-28. PMID: 453550
- ↑ Harman MT. and Dobrovolny P. The development of the external form of the guinea-pig (Cavia cobaya) between the ages of 11 days and 20 days of gestation. (1932) Amer. J Anat. 49(3) : 351-378.
- ↑ Harman MT. and Dobrovolny P. The development of the external form of the guinea-pig (Cavia cobaya) between the ages of 21 days and 35 days of gestation. (1933) J. of Morphology, 54(3): 493-519.
- ↑ Edwards, JA. The external development of the rabbit and rat embryo. In: D.H.M. Woollam, Editor, Advances in Teratology Vol. 3, Logos Press, London (1968)
- ↑ Bryden MM, Evans HE & Binns W. (1972). Embryology of the sheep. I. Extraembryonic membranes and the development of body form. J. Morphol. , 138, 169-85. PMID: 5078578 DOI.
- ↑ Marrable , AW. The Embryonic Pig: A Chronological Account. Pitman Medical, London (1971)
- ↑ Hamburger V & Hamilton HL. (1992). A series of normal stages in the development of the chick embryo. 1951. Dev. Dyn. , 195, 231-72. PMID: 1304821 DOI.
- ↑ Cretekos CJ, Weatherbee SD, Chen CH, Badwaik NK, Niswander L, Behringer RR & Rasweiler JJ. (2005). Embryonic staging system for the short-tailed fruit bat, Carollia perspicillata, a model organism for the mammalian order Chiroptera, based upon timed pregnancies in captive-bred animals. Dev. Dyn. , 233, 721-38. PMID: 15861401 DOI.
Earlier Stage Timing
| Carnegie | Stage | |||||||||||||||||||||||
| Human | Days | 1 | 2-3 | 4-5 | 5-6 | 7-12 | 13-15 | 15-17 | 17-19 | 20 | 22 | 24 | 28 | 30 | 33 | 36 | 40 | 42 | 44 | 48 | 52 | 54 | 55 | 58 |
| Mouse | Days | 1 | 2 | 3 | E4.5 | E5.0 | E6.0 | E7.0 | E8.0 | E9.0 | E9.5 | E10 | E10.5 | E11 | E11.5 | E12 | E12.5 | E13 | E13.5 | E14 | E14.5 | E15 | E15.5 | E16 |
| Rat | Days | 1 | 3.5 | 4-5 | 5 | 6 | 7.5 | 8.5 | 9 | 10.5 | 11 | 11.5 | 12 | 12.5 | 13 | 13.5 | 14 | 14.5 | 15 | 15.5 | 16 | 16.5 | 17 | 17.5 |
| Note these Carnegie stages are only approximate day timings for average of embryos. Links: Carnegie Stage Comparison | ||||||||||||||||||||||||
| ||||||||||||||||||||||||
Heart Development Staging
The table below is from a 2016 review of human heart development.[1]
| Human | Mouse | ||||
|---|---|---|---|---|---|
| Carnegie Stage |
Post-ovulatory Days |
Size (mm) Greatest Length |
Theiler Stage |
Post-conception Days |
Size (mm) Crown-rump |
| 11 | 24 | 2.5 - 4.5 | 14 | 9 - 9.5 | 2.1 |
| 12 | 26 | 3 - 5 | 15 | 9.5 - 10.25 | 2.5 |
| 13 | 28 | 4 - 6 | 16 | 10.25 - 10.5 | 3.6 |
| 14 | 32 | 5 - 7 | 17 | 10.5 | 4.1 |
| 15 | 33 | 7 - 9 | 18 | 11 | 4.6 |
| 16 | 37 | 8 - 11 | 19 | 11.5 | 6 - 7 |
| 17 | 41 | 11 - 14 | 20 | 12 | 7 |
| 18 | 44 | 13 - 17 | 21 | 12.5 - 13 | 8.2 |
| 19 | 47.5 | 16 - 18 | 21 | 12.5 - 13 | 8.2 |
| 20 | 50.5 | 18 - 22 | 22 | 13.5 - 14 | 9.1 |
| 21 | 52 | 22 - 24 | 22 | 13.5 - 14 | 9.1 |
| 22 | 54 | 23 - 28 | 22 | 13.5 - 14 | 9.1 |
| 23 | 56.5 | 27 - 31 | 22 | 13.5 - 14 | 9.1 |
| 26 | 17.5 - 18 | 17.8 | |||
|
Notes: Carnegie Stages | Theiler Stage | Post-conception Days | Carnegie Stage Comparison Reference: Anderson RH. Teratogenecity in the setting of cardiac development and maldevelopment. (2016) | |||||
| Table 1. Comparison of Human and Murine Development | |||||
|---|---|---|---|---|---|
| Human | Mouse | ||||
| Carnegie Stage |
Post-ovulatory Days |
Size (mm) Greatest Length |
Theiler Stage |
Post-conception Days |
Size (mm) Crown-rump |
| 11 | 24 | 2.5 - 4.5 | 14 | 9 - 9.5 | 2.1 |
| 12 | 26 | 3 - 5 | 15 | 9.5 - 10.25 | 2.5 |
| 13 | 28 | 4 - 6 | 16 | 10.25 - 10.5 | 3.6 |
| 14 | 32 | 5 - 7 | 17 | 10.5 | 4.1 |
| 15 | 33 | 7 - 9 | 18 | 11 | 4.6 |
| 16 | 37 | 8 - 11 | 19 | 11.5 | 6 - 7 |
| 17 | 41 | 11 - 14 | 20 | 12 | 7 |
| 18 | 44 | 13 - 17 | 21 | 12.5 - 13 | 8.2 |
| 19 | 47.5 | 16 - 18 | 21 | 12.5 - 13 | 8.2 |
| 20 | 50.5 | 18 - 22 | 22 | 13.5 - 14 | 9.1 |
| 21 | 52 | 22 - 24 | 22 | 13.5 - 14 | 9.1 |
| 22 | 54 | 23 - 28 | 22 | 13.5 - 14 | 9.1 |
| 23 | 56.5 | 27 - 31 | 22 | 13.5 - 14 | 9.1 |
| 26 | 17.5 - 18 | 17.8 | |||
|
Notes: Human Embryonic Development | Carnegie Stages | Mouse Development | Theiler Stage | Post-conception Days | Carnegie Stage Comparison Reference: Anderson RH. Teratogenecity in the setting of cardiac development and maldevelopment. (2016) | |||||
Growth
The following growth data is from Mall (1910)[2]
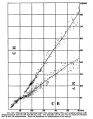
Fig. 143. Human Embryo Length
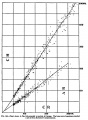
Fig. 146. Human Embryo and Fetal Lengths
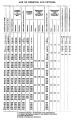
Table Human Embryo and Fetal Ages


References
- ↑ Anderson RH. Teratogenecity in the setting of cardiac development and maldevelopment. (2016)
- ↑ Mall FP. VIII. Determination of the age of human embryos and fetuses in Keibel F. and Mall FP. Manual of Human Embryology I. (1910) J. B. Lippincott Company, Philadelphia.
Glossary Links
- Glossary: A | B | C | D | E | F | G | H | I | J | K | L | M | N | O | P | Q | R | S | T | U | V | W | X | Y | Z | Numbers | Symbols | Term Link
Cite this page: Hill, M.A. (2026, July 28) Embryology Carnegie Stage Comparison. Retrieved from https://embryology.med.unsw.edu.au/embryology/index.php/Carnegie_Stage_Comparison
- © Dr Mark Hill 2026, UNSW Embryology ISBN: 978 0 7334 2609 4 - UNSW CRICOS Provider Code No. 00098G