Embryology Statistics
| Embryology - 27 Apr 2024 |
|---|
| Google Translate - select your language from the list shown below (this will open a new external page) |
|
العربية | català | 中文 | 中國傳統的 | français | Deutsche | עִברִית | हिंदी | bahasa Indonesia | italiano | 日本語 | 한국어 | မြန်မာ | Pilipino | Polskie | português | ਪੰਜਾਬੀ ਦੇ | Română | русский | Español | Swahili | Svensk | ไทย | Türkçe | اردو | ייִדיש | Tiếng Việt These external translations are automated and may not be accurate. (More? About Translations) |
Introduction
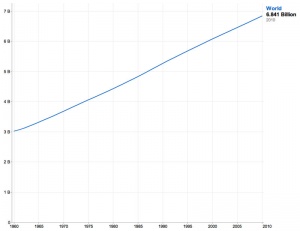
There are many different types of statistical analyses carried out in relation to normal and abnormal development. The best place to start is with the normal birth statistics. Always ensure when using any statistical data that you pay attention to when the information was collected or when it relates to as often it is the "trend" over time that is insightful to changes that may be occuring in the population. The World population calculated to have reached 7 billion (November 2011).
I have included separate pages with world data by country (Population, Fertility and Infant Mortality) and some selected country statistical information on the highest population countries (China, India, United States, Indonesia and Brazil) as well as some examples of highest developed countries (Australia, Canada, Germany, United Kingdom and United States).
| Statistics Links: Introduction | Reports | World Population | World Fertility | World Infant Mortality | Maternal Mortality | Australia | Brazil | Canada | China | Germany | India | Indonesia | Europe | Myanmar | Netherlands | Spain | United Kingdom | Romania | Uganda | United States | BGD Tutorial - Applied Embryology and Teratology | National Perinatal Statistics Unit | AIHW | Category:Statistics | |
|
<html5media width="600" height="500">https://www.youtube.com/embed/jbkSRLYSojo</html5media>
Some Recent Findings
|
World
- Links: Australia | Canada | India | United Kingdom | United States
World Health Statistics 2014
- Large gains in life expectancy - "A boy born in 2012 in a high-income country can expect to live to the age of around 76 – 16 years longer than a boy born in a low-income country (age 60). For girls, the difference is even wider; a gap of 19 years separates life expectancy in high-income (82 years) and low-income countries (63 years)."
- Most deaths among under-fives occur among children born prematurely (17.3%); pneumonia is responsible for the second highest number of deaths (15.2%).
- Links: World Health Statistics 2014
The World Health Report 1998
Population
- The global population was 2.8 billion in 1955 and is 5.8 billion now. It will increase by nearly 80 million people a year to reach about 8 billion by the year 2025.
- In 1955, 68% of the global population lived in rural areas and 32% in urban areas. (In 1995 the ratio was 55% rural and 45% urban; by 2025 it will be 41% rural and 59% urban).
- Every day in 1997, about 365 000 babies were born, and about 140 000 people died, giving a natural increase of about 220 000 people a day.
- Today's population is made up of 613 million children under 5; 1.7 billion children and adolescents aged 5-19; 3.1 billion adults aged 20-64; and 390 million over 65.
- The proportion of older people requiring support from adults of working age will increase from 10.5% in 1955 and 12.3% in 1995 to 17.2% in 2025.
- In 1955, there were 12 people aged over 65 for every 100 aged under 20. By 1995, the old/young ratio was 16/100; by 2025 it will be 31/100.
- The proportion of young people under 20 years will fall from 40% now to 32% of the total population by 2025, despite reaching 2.6 billion - an actual increase of 252 million.
- The number of people aged over 65 will rise from 390 million now to 800 million by 2025 - reaching 10% of the total population.
- By 2025, increases of up to 300% of the older population are expected in many developing countries, especially in Latin America and Asia.
- Globally, the population of children under 5 will grow by just 0.25% annually between 1995-2025, while the population over 65 years will grow by 2.6%.
- The average number of babies per woman of child-bearing age was 5.0 in 1955, falling to 2.9 in 1995 and reaching 2.3 in 2025. While only 3 countries were below the population replacement level of 2.1 babies in 1955, there will be 102 such countries by 2025.
Health of Infants and Small Children
- Spectacular progress in reducing under 5 mortality achieved in the last few decades is projected to continue. There were about 10 million such deaths in 1997 compared to 21 million in 1955.
- The infant mortality rate per 1000 live births was 148 in 1955; 59 in 1995; and is projected to be 29 in 2025. The under-5 mortality rates per 1000 live births for the same years are 210, 78 and 37 respectively.
- By 2025 there will still be 5 million deaths among children under five - 97% of them in the developing world, and most of them due to infectious diseases such as pneumonia and diarrhoea, combined with malnutrition.
- There are still 24 million low-birthweight babies born every year. They are more likely to die early, and those who survive may suffer illness, stunted growth or even problems into adult life.
- In 1995, 27% (168 million) of all children under 5 were underweight. Mortality rates are 5 times higher among severely underweight children than those of normal weight.
- About 50% of deaths among children under 5 are associated with malnutrition.
- At least two million a year of the under-five deaths could be prevented by existing vaccines. Most of the rest are preventable by other means.
Life Expectancy
- Average life expectancy at birth in 1955 was just 48 years; in 1995 it was 65 years; in 2025 it will reach 73 years.
- By the year 2025, it is expected that no country will have a life expectancy of less than 50 years.
- More than 50 million people live today in countries with a life expectancy of less than 45 years.
- Over 5 billion people in 120 countries today have life expectancy of more than 60 years.
- About 300 million people live in 16 countries where life expectancy actually decreased between 1975-1995.
- Many thousands of people born this year will live through the 21st century and see the advent of the 22nd century. For example, while there were only 200 centenarians in France in 1950, by the year 2050, the number is projected to reach 150 000 - a 750-fold increase in 100 years.
- Data: The World Health Report Published by WHO, 11 May 1998 ISBN 92 4 156189 0. WHO
Europe
Eurocat is a European network of population-based registries for the epidemiologic surveillance of congenital anomalies. Started in 1979 with more than 1.5 million births surveyed per year in Europe, 43 registries in 20 countries, and 29% of European birth population covered. High quality multiple source registries, ascertaining terminations of pregnancy as well as births.
- Links: eurocat
Australia
Australia's mothers and babies is an annual report providing information on births in Australia from perinatal data collections for each state and territory. The report presents demographic, pregnancy and childbirth factors of women who gave birth in that year and the characteristics and outcomes of their babies.
- Links: Australia | Australia’s mothers and babies 2008 | Australia’s mothers and babies 2007 | Abnormal Development - Australian Statistics | BGD Tutorial - Applied Embryology and Teratology |
World Population 2011
Data approximates to beginning of 2011.
| Rank | Country | Population |
| 1 | China | 1,336,718,015 |
| 2 | India | 1,189,172,906 |
| 3 | United States | 313,232,044 |
| 4 | Indonesia | 245,613,043 |
| 5 | Brazil | 203,429,773 |
| 6 | Pakistan | 187,342,721 |
| 7 | Bangladesh | 158,570,535 |
| 8 | Nigeria | 155,215,573 |
| 9 | Russia | 138,739,892 |
| 10 | Japan | 126,475,664 |
| 11 | Mexico | 113,724,226 |
| 12 | Philippines | 101,833,938 |
| 13 | Ethiopia | 90,873,739 |
| 14 | Vietnam | 90,549,390 |
| 15 | Egypt | 82,079,636 |
| 16 | Germany | 81,471,834 |
| 17 | Turkey | 78,785,548 |
| 18 | Iran | 77,891,220 |
| 19 | Congo, Democratic Republic of the | 71,712,867 |
| 20 | Thailand | 66,720,153 |
| 21 | France | 65,312,249 |
| 22 | United Kingdom | 62,698,362 |
| 23 | Italy | 61,016,804 |
| 24 | Burma | 53,999,804 |
| 25 | South Africa | 49,004,031 |
| 26 | Korea, South | 48,754,657 |
| 27 | Spain | 46,754,784 |
| 28 | Ukraine | 45,134,707 |
| 29 | Sudan | 45,047,502 |
| 30 | Colombia | 44,725,543 |
| 31 | Tanzania | 42,746,620 |
| 32 | Argentina | 41,769,726 |
| 33 | Kenya | 41,070,934 |
| 34 | Poland | 38,441,588 |
| 35 | Algeria | 34,994,937 |
| 36 | Uganda | 34,612,250 |
| 37 | Canada | 34,030,589 |
| 38 | Morocco | 31,968,361 |
| 39 | Iraq | 30,399,572 |
| 40 | Afghanistan | 29,835,392 |
| 41 | Nepal | 29,391,883 |
| 42 | Peru | 29,248,943 |
| 43 | Malaysia | 28,728,607 |
| 44 | Uzbekistan | 28,128,600 |
| 45 | Venezuela | 27,635,743 |
| 46 | Saudi Arabia | 26,131,703 |
| 47 | Ghana | 24,791,073 |
| 48 | Korea, North | 24,457,492 |
| 49 | Yemen | 24,133,492 |
| 50 | Taiwan | 23,071,779 |
| 51 | Mozambique | 22,948,858 |
| 52 | Syria | 22,517,750 |
| 53 | Madagascar | 21,926,221 |
| 54 | Romania | 21,904,551 |
| 55 | Australia | 21,766,711 |
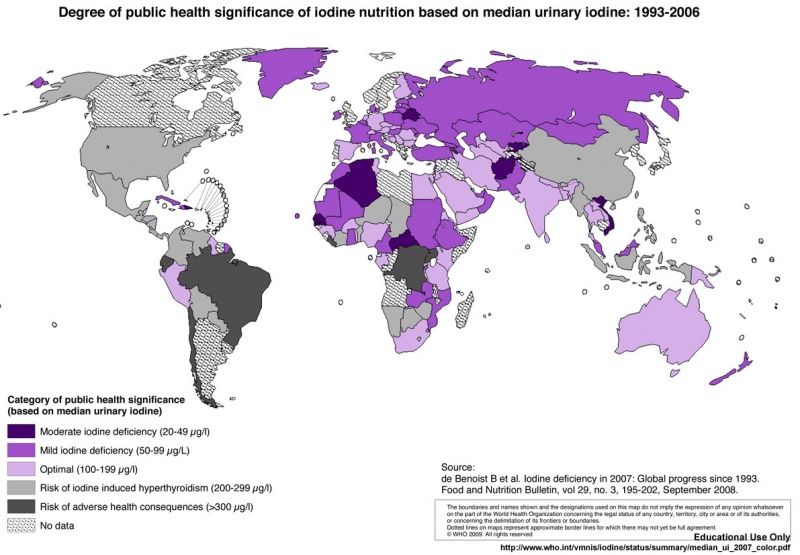
World Iodine Status
WHO Statistics World map iodine status (2007)[2]
- Links: Abnormal Development - Iodine Deficiency | Endocrine - Thyroid Development | Neural System Development | Neural System - Abnormalities | WHO Micronutrients Database
References
- ↑ Michalski AM, Richardson SD, Browne ML, Carmichael SL, Canfield MA, VanZutphen AR, Anderka MT, Marshall EG & Druschel CM. (2015). Sex ratios among infants with birth defects, National Birth Defects Prevention Study, 1997-2009. Am. J. Med. Genet. A , 167A, 1071-81. PMID: 25711982 DOI.
- ↑ Bruno de Benoist, B Erin McLean, Maria Andersson, and Lisa Rogers Iodine deficiency in 2007: Global progress since 1993. Food and Nutrition Bulletin, vol. 29, no. 3 © 2008, The United Nations University. PDF
Books
- WHO Guidelines on Preventing Early Pregnancy and Poor Reproductive Health Outcomes Among Adolescents in Developing Countries. Geneva: World Health Organization; 2011. Available from: http://www.ncbi.nlm.nih.gov/books/NBK304954/
Terms
| Statistics Terms (expand to view) |
|---|
Birth | Embryology Statistics
|
| Other Terms Lists |
|---|
| Terms Lists: ART | Birth | Bone | Cardiovascular | Cell Division | Endocrine | Gastrointestinal | Genital | Genetic | Head | Hearing | Heart | Immune | Integumentary | Neonatal | Neural | Oocyte | Palate | Placenta | Radiation | Renal | Respiratory | Spermatozoa | Statistics | Tooth | Ultrasound | Vision | Historic | Drugs | Glossary |
External Links
External Links Notice - The dynamic nature of the internet may mean that some of these listed links may no longer function. If the link no longer works search the web with the link text or name. Links to any external commercial sites are provided for information purposes only and should never be considered an endorsement. UNSW Embryology is provided as an educational resource with no clinical information or commercial affiliation.
- World Health Organization WHO Statistics | WHO Micronutrients Database
- UNICEF Statistics
- USA The World Factbook
- CDC - Reproductive Health Since 1973, CDC's Division of Reproductive Health has produced Reproductive Health Surveys (RHS), with funding from USAID. These national level, household-based representative surveys interview large samples of women (and sometimes men) of reproductive age. Geographically, the surveys have been focused in Latin America and Eastern Europe, with some surveys in Africa.
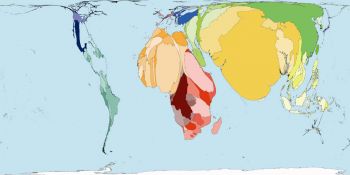
- Worldmapper | Map list
Glossary Links
- Glossary: A | B | C | D | E | F | G | H | I | J | K | L | M | N | O | P | Q | R | S | T | U | V | W | X | Y | Z | Numbers | Symbols | Term Link
Cite this page: Hill, M.A. (2024, April 27) Embryology Embryology Statistics. Retrieved from https://embryology.med.unsw.edu.au/embryology/index.php/Embryology_Statistics
- © Dr Mark Hill 2024, UNSW Embryology ISBN: 978 0 7334 2609 4 - UNSW CRICOS Provider Code No. 00098G


