USA Statistics
| Embryology - 17 May 2026 |
|---|
| Google Translate - select your language from the list shown below (this will open a new external page) |
|
العربية | català | 中文 | 中國傳統的 | français | Deutsche | עִברִית | हिंदी | bahasa Indonesia | italiano | 日本語 | 한국어 | မြန်မာ | Pilipino | Polskie | português | ਪੰਜਾਬੀ ਦੇ | Română | русский | Español | Swahili | Svensk | ไทย | Türkçe | اردو | ייִדיש | Tiếng Việt These external translations are automated and may not be accurate. (More? About Translations) |
Introduction

This page links to the current online resources available to explore United States (USA) population and birth data. The United States is the third most populace country in the world (313,232,044, 2011 data).
See also USA Recommended Immunizations for Children.
- USA Links: Abnormality Monitoring Programmes | 2006 Abnormality Table | Folic Acid | Assisted Reproductive Technology | Recommended Immunizations | 1990 Embryology in the United States | Embryology Statistics | Category:USA
| Statistics Links: Introduction | Reports | World Population | World Fertility | World Infant Mortality | Maternal Mortality | Australia | Brazil | Canada | China | Germany | India | Indonesia | Europe | Myanmar | Netherlands | Spain | United Kingdom | Romania | Uganda | United States | BGD Tutorial - Applied Embryology and Teratology | National Perinatal Statistics Unit | AIHW | Category:Statistics | |
|
United States Births
2018
vaccinationInfections in Pregnancy and the Role of Vaccines[1] "Pregnant women are at risk for infection and may have significant morbidity or mortality. Influenza, pertussis, zika, and cytomegalovirus produce mild or asymptomatic illness in the mother, but have profound implications for her fetus. Maternal immunization can prevent or mitigate infections in pregnant women and their infants. The Advisory Committee of Immunization Practices (USA) recommends 2 vaccines during pregnancy: inactivated influenza, and tetanus toxoid, reduced diphtheria toxoid, and acellular pertussis during pregnancy. The benefits of MMR, varicella, and other vaccines are reviewed. Novel vaccine studies for use during pregnancy for prevention of illness are explored."
2016
| Update on Zika Virus-Associated Birth Defects and Evaluation of All U.S. Infants with Congenital Zika Virus Exposure - U.S. Zika Pregnancy Registry, 2016[2]
"During the analysis period, 1,297 pregnant women in 44 states were reported to the USZPR. Zika virus-associated birth defects were reported for 51 (5%) of the 972 fetuses/infants from completed pregnancies with laboratory evidence of possible recent Zika virus infection (95% confidence interval [CI] = 4%-7%); the proportion was higher when restricted to pregnancies with laboratory-confirmed Zika virus infection (24/250 completed pregnancies [10%, 95% CI = 7%-14%]). Birth defects were reported in 15% (95% CI = 8%-26%) of fetuses/infants of completed pregnancies with confirmed Zika virus infection in the first trimester. Among 895 liveborn infants from pregnancies with possible recent Zika virus infection, postnatal neuroimaging was reported for 221 (25%), and Zika virus testing of at least one infant specimen was reported for 585 (65%). Conclusions And Implications For Public Health Practice: These findings highlight why pregnant women should avoid Zika virus exposure. Because the full clinical spectrum of congenital Zika virus infection is not yet known, all infants born to women with laboratory evidence of possible recent Zika virus infection during pregnancy should receive postnatal neuroimaging and Zika virus testing in addition to a comprehensive newborn physical exam and hearing screen. Identification and follow-up care of infants born to women with laboratory evidence of possible recent Zika virus infection during pregnancy and infants with possible congenital Zika virus infection can ensure that appropriate clinical services are available." (More? Zika Virus) |

|
2015
- The 2014 preliminary number of U.S. births was 3,985,924 an increase of 1% from 2013 (Data are based on 99.71% of 2014 births).

- Links: Caesarean Delivery | Birth
2014
- Births Resulting From Assisted Reproductive Technology: Comparing Birth Certificate and National ART Surveillance System Data, 2011.[3] "This report compares data on births resulting from assisted reproductive technology (ART) procedures from 2011 birth certificates with data from the 2011 National ART Surveillance System (NASS) among the subset of jurisdictions that adopted the 2003 revised birth certificate as of January 1, 2011, with information on ART. Births resulting from ART procedures appear to be underreported on the birth certificate; however, the magnitude of underreporting varied by jurisdiction and maternal-infant health characteristics." Assisted Reproductive Technology
- Congenital anomalies identified at birth among infants born following assisted reproductive technology in Colorado[4] "This study suggests that conception by means of ART is not associated with an increased risk of congenital abnormalities identified by birth certificate data in Colorado when compared with births following natural conception."
- Prevalence Estimates of Gestational Diabetes Mellitus in the United States, Pregnancy Risk Assessment Monitoring System (PRAMS), 2007-2010[5] "Gestational diabetes mellitus (GDM) prevalence in 2010 was 4.6% as reported on the birth certificate, 8.7% as reported on the PRAMS questionnaire, and 9.2% as reported on either the birth certificate or questionnaire. The agreement between sources was 94.1% (percent positive agreement = 3.7%, percent negative agreement = 90.4%). There was no significant difference in GDM prevalence between 2007-2008 (8.1%) and 2009-2010 (8.5%, P = .15). Our results indicate that GDM prevalence is as high as 9.2% and is more likely to be reported on the PRAMS questionnaire than the birth certificate. We found no statistical difference in GDM prevalence between the 2 phases. Further studies are needed to understand discrepancies in reporting GDM by data source." Maternal Diabetes
- Searching for the Definition of Macrosomia through an Outcome-Based Approach[6] "Macrosomia has been defined in various ways by obstetricians and researchers. The purpose of the present study was to search for a definition of macrosomia through an outcome-based approach. In a study of 30,831,694 singleton term live births and 38,053 stillbirths in the U.S. Linked Birth-Infant Death Cohort datasets (1995-2004), we compared the occurrence of stillbirth, neonatal death, and 5-min Apgar score less than four in subgroups of birthweight (4000-4099 g, 4100-4199 g, 4200-4299 g, 4300-4399 g, 4400-4499 g, 4500-4999 g vs. reference group 3500-4000 g) and birthweight percentile for gestational age (90th-94th percentile, 95th-96th, and ≥97th percentile, vs. reference group 75th-90th percentile). There was no significant increase in adverse perinatal outcomes until birthweight exceeded the 97th percentile. A birthweight greater than 4500 g in Whites, or 4300 g in Blacks and Hispanics regardless of gestational age is the optimal threshold to define macrosomia. A birthweight greater than the 97th percentile for a given gestational age, irrespective of race is also reasonable to define macrosomia. The former may be more clinically useful and simpler to apply." Birth - Macrosomia | Birth Weight
2013

USA Live Births and general fertility rates (1920–2013)[7]

USA Caesarean delivery by gestational age (2009, 2012, and 2013)[7]
- The cesarean delivery rate, which had been stable at 32.8% for 2010–2012, declined to 32.7% of all U.S. births in 2013.
- Declines in cesarean deliveries were seen at 38, 40, and 41 completed weeks of gestation in 2013 from 2012.
- Links: Caesarean Delivery | Birth
2012
- Number of births - 3,952,841
- Birth rate - 12.6 per 1,000 population
- Fertility rate - 63.0 births per 1000 women aged 15-44 years
- Percent born low birthweight - 8.0%
- Percent born preterm - 11.5%
- Percent unmarried - 40.7%
- Mean age at first birth - 25.8
2010-2011
United States Annual summary of vital statistics: 2010-2011[8]
- Number of births declined by 1% between 2010 and 2011, to a total of 3 953 593.
- General fertility rate declined by 1% to 63.2 births per 1000 women, the lowest rate ever reported.
- Total fertility rate was down by 2% in 2011 (to 1894.5 births per 1000 women).
- Teenage birth rate fell to another historic low in 2011, 31.3 births per 1000 women.
- Birth rates also declined for women aged 20 to 29 years, but the rates increased for women aged 35 to 39 and 40 to 44 years.
- Percentage of births to unmarried women declined slightly to 40.7% in 2011, from 40.8% in 2010.
- Cesarean delivery rate for 2011 was unchanged from 2010 at 32.8%.
- Preterm birth rate declined for the fifth straight year in 2011 to 11.72%
- Low birth weight rate declined slightly to 8.10%.
- Infant mortality rate was 6.05 infant deaths per 1000 live births in 2011.
- not significantly lower than the rate of 6.15 deaths in 2010.
- Life expectancy at birth was 78.7 years in 2011, which was unchanged from 2010.
- Crude death rates for children aged 1 to 19 years did not change significantly between 2010 and 2011.
- Unintentional injuries and homicide were the first and second leading causes of death, respectively, in this age group.
- These 2 causes of death jointly accounted for 47.0% of all deaths of children and adolescents in 2011.
2005-2010


Source - CDC/NCHS, National Vital Statistics System.
Preterm Birth Rate
Preterm birth rates per 100 births in each specified gestational age category.
| Total preterm | Extremely preterm | Early preterm | Late preterm |
| less than 37 weeks’ gestation | less than 28 weeks’ gestation | less than 34 weeks’ gestation | 34–36 weeks’ gestation |
| 12.7 | 0.8 | 3.6 | 9.0 |
- Data: USA Preterm birth rates national Vital Statistics System, United States, 2007.
- Links: birth | Preterm Birth
Intended and Unintended Births
The following data is from the National Center for Health Statistics report "Intended and unintended births in the United States: 1982-2010".[9] Data used in report primarily from the 2006-2010 National Survey of Family Growth (NSFG), conducted by the Centers for Disease Control and Prevention's National Center for Health Statistics. The 2006-2010 NSFG included in-person interviews with 12,279 women aged 15-44. Some data in the trend analyses are taken from NSFG surveys conducted in 1982, 1988, 1995, and 2002.
- About 37% of births in the United States were unintended at the time of conception.
- The overall proportion unintended has not declined significantly since 1982.
- The proportion unintended did decline significantly between 1982 and 2006-2010 among births to married, non-Hispanic white women.
- Large differences exist between groups in the percentage of births that are unintended. For example, unmarried women, black women, and women with less education or income are still much more likely to experience unintended births compared with married, white, college-educated, and high-income women.

|

|
| Intended births[9] | Unintended births[9] |
Terms
- Intended - Planned; at the right time; wanted then
- Unintended - Unplanned
- Mistimed - Wanted later
- Unwanted - Never wanted
- Links: Pregnancy Risk Assessment Monitoring System | National Campaign to Prevent Teen and Unplanned Pregnancy
National Collaborative Perinatal Project
The National Collaborative Perinatal Project (NCPP) or Collaborative Perinatal Project (CPP) is a rich data set for the investigation of a variety of topics related to maternal and child health[10] and in 2009 NCPP celebrated its 50th year.[11]
A summary of NCPP findings include:[11]
- Events of labour and delivery are not major contributors to the occurrence of cerebral palsy nor most other neurodevelopmental disorders in children.
- Simple febrile convulsions are a common (occurring to around 3% of children) and benign event of childhood.
- Intrauterine inflammation is a major cause of adverse pregnancy outcome.
- Neonatal jaundice, even in the absence of clinical signs of bilirubin toxicity, is associated with long-term neuro-developmental sequelae.
- Neonatal jaundice in the absence of clinical signs of bilirubin toxicity is not associated with major long-term neuro-developmental sequelae.
- Sudden infant death syndrome was not a random event, and its occurrence was elevated with smoking mothers.
- Optimal weight gain during pregnancy varied according to pre-pregnancy weight.
Abnormalities
| USA Selected Abnormalities (CDC National estimates for 21 selected major birth defects 2004–2006) | ||
|---|---|---|
| Birth Defects | Cases per Births (1 in ...) | Estimated Annual Number of Cases |
| anencephaly | 4,859 | 859 |
| spina bifida without anencephaly | 2,858 | 1,460 |
| encephalocele | 12,235 | 341 |
| Anophthalmia/microphthalmia | 5,349 | 780 |
| patent ductus arteriosus/common truncus | 13,876 | 301 |
| transposition of the great vessels | 3,333 | 1,252 |
| Tetralogy of Fallot | 2,518 | 1,657 |
| atrial septal defects/ventricular septal defects | 2,122 | 1,966 |
| hypoplastic left heart | 4,344 | 960 |
| cleft palate without cleft lip | 1,574 | 2,651 |
| cleft lip with and without cleft palate | 940 | 4,437 |
| Esophageal atresia/tracheoesophageal fistula | 4,608 | 905 |
| Rectal and large intestinal atresia/stenosis | 2,138 | 1,952 |
| Reduction deformity, upper limbs | 2,869 | 1,454 |
| Reduction deformity, lower limbs | 5,949 | 701 |
| gastroschisis | 2,229 | 1,871 |
| omphalocele | 5,386 | 775 |
| Diaphragmatic hernia | 3,836 | 1,088 |
| Trisomy 13 | 7,906 | 528 |
| Trisomy 21 (Down syndrome) | 691 | 6,037 |
| Trisomy 18 | 3,762 | 1,109 |
| Abnormalities from Nationwide Inpatient Sample (NIS) database (1998 to 2008) | |
|---|---|

|

|
| Graphs[12] |
Sex Ratio
| Male preponderance | Female preponderance |
|---|---|
|
|
| Cardiac defects | |
|
|
| Table data[13] Links: abnormal development | cardiovascular abnormalities | USA | Male | Female | cleft lip and palate | |
General Statistics
Population: 313,232,044 (July 2011 est.) country comparison to the world: 3
Age structure
- 0-14 years: 20.1% (male 32,107,900/female 30,781,823)
- 15-64 years: 66.8% (male 104,411,352/female 104,808,064)
- 65 years and over: 13.1% (male 17,745,363/female 23,377,542) (2011 est.)
Median age
- total: 36.9 years
- male: 35.6 years
- female: 38.2 years (2011 est.)
Population growth rate
- 0.963% (2011 est.)
- country comparison to the world: 119
Birth rate
- 13.83 births/1,000 population (2011 est.)
- country comparison to the world: 149
Death rate
- 8.38 deaths/1,000 population (July 2011 est.)
- country comparison to the world: 89
Sex ratio
- at birth: 1.047 male(s)/female
- under 15 years: 1.04 male(s)/female
- 15-64 years: 1 male(s)/female
- 65 years and over: 0.75 male(s)/female
- total population: 0.97 male(s)/female (2011 est.)
Infant mortality rate
- total: 6.06 deaths/1,000 live births
- country comparison to the world: 176
- male: 6.72 deaths/1,000 live births
- female: 5.37 deaths/1,000 live births (2011 est.)
Life expectancy at birth
- total population: 78.37 years
- country comparison to the world: 50
- male: 75.92 years
- female: 80.93 years (2011 est.)
Total fertility rate
- 2.06 children born/woman (2011 est.)
- country comparison to the world: 123
HIV/AIDS
adult prevalence rate
- 0.6% (2009 est.)
- country comparison to the world: 63
people living with HIV/AIDS
- 1.2 million (2009 est.)
- country comparison to the world: 10
deaths
- 17,000 (2009 est.)
- country comparison to the world: 18
Ethnic groups
- white 79.96% black 12.85%, Asian 4.43%, Amerindian and Alaska native 0.97%, native Hawaiian and other Pacific islander 0.18%, two or more races 1.61% (July 2007 estimate)
note: a separate listing for Hispanic is not included because the US Census Bureau considers Hispanic to mean persons of Spanish/Hispanic/Latino origin including those of Mexican, Cuban, Puerto Rican, Dominican Republic, Spanish, and Central or South American origin living in the US who may be of any race or ethnic group (white, black, Asian, etc.); about 15.1% of the total US population is Hispanic
Data: The World Factbook United States
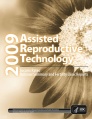
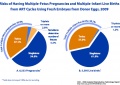
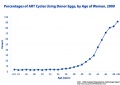
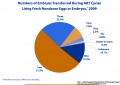
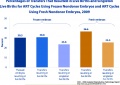
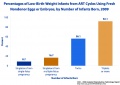
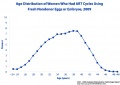
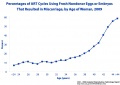
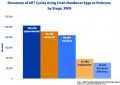
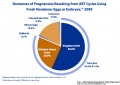
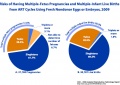
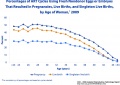
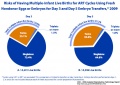
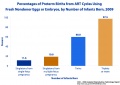
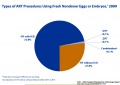
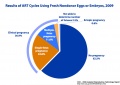
Assisted Reproductive Technologies

2012 Assisted Reproductive Technology National Summary Report[14]
- ART procedures reported with the intention to transfer at least one embryo (157,662 cycles of the 176,247 total ART cycles performed in 2012).
- ART cycles started with the intention of freezing and banking all resulting eggs or embryos (18,585 cycles of the 176,247 total).
- ART additional cycles in which a new treatment procedure was being evaluated (27 total new treatment procedures in 2012 that are not counted as part of the 176,247 total ART cycles performed in 2012).
- ART cycles that used only fresh nondonor eggs or embryos from nondonor eggs or, in a few cases, a mixture of fresh and frozen embryos from nondonor eggs (99,665 cycles resulting in 80,783 transfers).
- ART cycles that used only frozen embryos from nondonor eggs (38,150 cycles resulting in 35,508 transfers).
- ART cycles that used only donated eggs or embryos (19,847 cycles resulting in 18,154 transfers).

Report cover
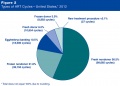
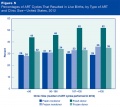
Types of ART cycles
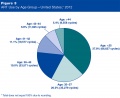
Maternal age
Types of ART by Maternal age
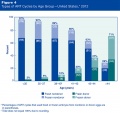
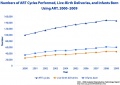
Live Births by ART Type and Clinic Size


Report cover
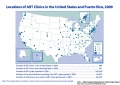
clinics
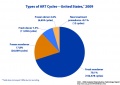
types of ART
outcomes
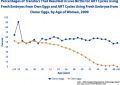
donor-vs-own-eggs
donor fresh outcomes
maternal age
nondonor embryos transferred
nondonor frozen fresh outcomes
nondonor low birthweight
nondonor maternal age
nondonor miscarriage
nondonor outcomes 1
nondonor outcomes 2
nondonor outcomes 3
nondonor outcomes 4
nondonor outcomes 5
nondonor preterm
nondonor procedure
nondonor results


- Graph Links: Report cover | clinics | types of ART | outcomes | donor-vs-own-eggs | donor fresh outcomes | maternal age | nondonor embryos transferred | nondonor frozen fresh outcomes | nondonor low birthweight | nondonor maternal age | nondonor miscarriage | nondonor outcomes 1 | nondonor outcomes 2 | nondonor outcomes 3 | nondonor outcomes 4 | nondonor outcomes 5 | nondonor preterm | nondonor procedure | nondonor results | ART USA | Assisted Reproductive Technology
Congenital Abnormalities
PRAMS is the cronym for the Pregnancy Risk Assessment Monitoring System, is a surveillance project of the United States Centers for Disease Control and Prevention (CDC) and state health departments. PRAMS collects state-specific, population-based data on maternal attitudes and experiences before, during, and shortly after pregnancy.
|
Estimated annual number of United States children with long-term sequelae caused by various disease conditions.[15]
|

|
Assumes 4 million live births per year and 20 million children less than 5 years of age. Where applicable, numbers represent means of published estimates. All estimates should be considered useful for rough comparisons only since surveillance methodology, time periods, and diagnostic accuracy varied by study.
- Links: Cytomegalovirus | Torch Infections | Trisomy 21 | Fetal Alcohol Syndrome | DCD - PRAMS
Ectopic Pregnancy

Ectopic pregnancy Hospitalizations of women 15 to 44 years of age: United States, 1997–2006[16]

Ectopic Pregnancies - United-States (1970-1992)[17]
Neural Tube Defects


CDC Trends in Spina Bifida and Anencephalus in the United States, 1991-2005[18]
Teen Pregnancy

Pertussis Trends

Map shows state by state trend changes in pertussis notifications for 2014.
Pertussis (whooping cough, 100-day cough) is a highly contagious bacterial (Bordetella pertussis) infection prevented by vaccination with the pertussis vaccine. Symptoms are initially similar to the common cold. Neonatal infection can be fatal, with 1% of infected infants under one year of age dying, other complications include: pneumonia (lung infection), convulsions (violent, uncontrolled shaking), apnea (slowed or stopped breathing) and encephalopathy (disease of the brain).
- Links: Postnatal - Infectious Diseases School Exclusion | Bacterial Infection | Neonatal Development
References
- ↑ Fortner KB, Nieuwoudt C, Reeder CF & Swamy GK. (2018). Infections in Pregnancy and the Role of Vaccines. Obstet. Gynecol. Clin. North Am. , 45, 369-388. PMID: 29747736 DOI.
- ↑ Reynolds MR, Jones AM, Petersen EE, Lee EH, Rice ME, Bingham A, Ellington SR, Evert N, Reagan-Steiner S, Oduyebo T, Brown CM, Martin S, Ahmad N, Bhatnagar J, Macdonald J, Gould C, Fine AD, Polen KD, Lake-Burger H, Hillard CL, Hall N, Yazdy MM, Slaughter K, Sommer JN, Adamski A, Raycraft M, Fleck-Derderian S, Gupta J, Newsome K, Baez-Santiago M, Slavinski S, White JL, Moore CA, Shapiro-Mendoza CK, Petersen L, Boyle C, Jamieson DJ, Meaney-Delman D & Honein MA. (2017). Vital Signs: Update on Zika Virus-Associated Birth Defects and Evaluation of All U.S. Infants with Congenital Zika Virus Exposure - U.S. Zika Pregnancy Registry, 2016. MMWR Morb. Mortal. Wkly. Rep. , 66, 366-373. PMID: 28384133 DOI.
- ↑ Thoma ME, Boulet S, Martin JA & Kissin D. (2014). Births resulting from assisted reproductive technology: comparing birth certificate and National ART Surveillance System Data, 2011. Natl Vital Stat Rep , 63, 1-11. PMID: 25493705
- ↑ Moses XJ, Torres T, Rasmussen A & George C. (2014). Congenital anomalies identified at birth among infants born following assisted reproductive technology in Colorado. Birth Defects Res. Part A Clin. Mol. Teratol. , 100, 92-9. PMID: 24532453 DOI.
- ↑ DeSisto CL, Kim SY & Sharma AJ. (2014). Prevalence estimates of gestational diabetes mellitus in the United States, Pregnancy Risk Assessment Monitoring System (PRAMS), 2007-2010. Prev Chronic Dis , 11, E104. PMID: 24945238 DOI.
- ↑ Ye J, Zhang L, Chen Y, Fang F, Luo Z & Zhang J. (2014). Searching for the definition of macrosomia through an outcome-based approach. PLoS ONE , 9, e100192. PMID: 24941024 DOI.
- ↑ 7.0 7.1 Martin JA, Hamilton BE, Osterman MJK, et al. Births: Final data for 2013. National vital statistics reports; vol 64 no 1. Hyattsville, MD: National Center for Health Statistics. 2015. http://www.cdc.gov/nchs/data/nvsr/nvsr64/nvsr64_01.pdf
- ↑ Hamilton BE, Hoyert DL, Martin JA, Strobino DM & Guyer B. (2013). Annual summary of vital statistics: 2010-2011. Pediatrics , 131, 548-58. PMID: 23400611 DOI.
- ↑ 9.0 9.1 9.2 Mosher WD, Jones J & Abma JC. (2012). Intended and unintended births in the United States: 1982-2010. Natl Health Stat Report , , 1-28. PMID: 23115878
- ↑ Hardy JB. (2003). The Collaborative Perinatal Project: lessons and legacy. Ann Epidemiol , 13, 303-11. PMID: 12821268
- ↑ 11.0 11.1 Klebanoff MA. (2009). The Collaborative Perinatal Project: a 50-year retrospective. Paediatr Perinat Epidemiol , 23, 2-8. PMID: 19228308 DOI.
- ↑ Egbe A, Lee S, Ho D, Uppu S & Srivastava S. (2014). Prevalence of congenital anomalies in newborns with congenital heart disease diagnosis. Ann Pediatr Cardiol , 7, 86-91. PMID: 24987252 DOI.
- ↑ Michalski AM, Richardson SD, Browne ML, Carmichael SL, Canfield MA, VanZutphen AR, Anderka MT, Marshall EG & Druschel CM. (2015). Sex ratios among infants with birth defects, National Birth Defects Prevention Study, 1997-2009. Am. J. Med. Genet. A , 167A, 1071-81. PMID: 25711982 DOI.
- ↑ Centers for Disease Control and Prevention, American Society for Reproductive Medicine, Society for Assisted Reproductive Technology. 2012 Assisted Reproductive Technology National Summary Report. Atlanta (GA): US Dept of Health and Human Services; 2014. http://www.cdc.gov/art/ART2012
- ↑ Centers for Disease Control and Prevention, Congenital CMV Infection Trends and Statistics http://www.cdc.gov/cmv/trends-stats.html, viewed 6 November 2012 (EST).
- ↑ National Health Statistics Report, 2006 National Hospital Discharge Survey. 2008 July. Report Number 5. Atlanta: Centers for Disease Control and Prevention.
- ↑ Centers for Disease Control and Prevention (CDC). (1995). Ectopic pregnancy--United States, 1990-1992. MMWR Morb. Mortal. Wkly. Rep. , 44, 46-8. PMID: 7823895
- ↑ CDC Trends in Spina Bifida and Anencephalus in the United States, 1991-2005 [1]
Books
- National Center for Health Statistics (US). Health, United States, 2014: With Special Feature on Adults Aged 55–64. Hyattsville (MD): National Center for Health Statistics (US); 2015 May. Available from: http://www.ncbi.nlm.nih.gov/books/NBK299348/
- National Research Council (US) Committee on Acute Exposure Guideline Levels. Acute Exposure Guideline Levels for Selected Airborne Chemicals: Volume 8. Washington (DC): National Academies Press (US); 2010. Available from: http://www.ncbi.nlm.nih.gov/books/NBK220012/
External Links
External Links Notice - The dynamic nature of the internet may mean that some of these listed links may no longer function. If the link no longer works search the web with the link text or name. Links to any external commercial sites are provided for information purposes only and should never be considered an endorsement. UNSW Embryology is provided as an educational resource with no clinical information or commercial affiliation.
- Centers for Disease Control and Prevention
- Vital Statistics Data Available Online | VitalStats - Perinatal Mortality
- CDC Child Growth Charts United States Clinical Growth Charts
- CDC National Center for Health Statistics Intended and Unintended Births in the United States: 1982–2010 PDF (July 24, 2012)
- CDC Assisted Reproductive Technology
- CDC DCD - PRAMS
- U.S. Census Bureau U.S. Census Bureau | Publications
- The World Factbook United States
- National Conference of State Legislatures Embryo and Gamete Disposition Laws Updated July 2007
- Pregnancy Risk Assessment Monitoring System PRAMS
- National Campaign to Prevent Teen and Unplanned Pregnancy
- National Center for Health Statistics Use of contraception in the United States: 1982–2008. Vital Health Stat 23(29). 2010. series/sr_23/sr23_029.pdf PDF
Glossary Links
- Glossary: A | B | C | D | E | F | G | H | I | J | K | L | M | N | O | P | Q | R | S | T | U | V | W | X | Y | Z | Numbers | Symbols | Term Link
Cite this page: Hill, M.A. (2026, Mayıs 17) Embryology USA Statistics. Retrieved from https://embryology.med.unsw.edu.au/embryology/index.php/USA_Statistics
- © Dr Mark Hill 2026, UNSW Embryology ISBN: 978 0 7334 2609 4 - UNSW CRICOS Provider Code No. 00098G