Australian Statistics
| Embryology - 26 Jul 2026 |
|---|
| Google Translate - select your language from the list shown below (this will open a new external page) |
|
العربية | català | 中文 | 中國傳統的 | français | Deutsche | עִברִית | हिंदी | bahasa Indonesia | italiano | 日本語 | 한국어 | မြန်မာ | Pilipino | Polskie | português | ਪੰਜਾਬੀ ਦੇ | Română | русский | Español | Swahili | Svensk | ไทย | Türkçe | اردو | ייִדיש | Tiếng Việt These external translations are automated and may not be accurate. (More? About Translations) |
Introduction


This page links to the current online resources available to explore Australian statistics using population and birth data. The Australian Bureau of Statistics has detailed demographical information about the Australian population.
- Population size in 2021 has just reached 25.7 million. Back in 2015, there were more people living in 3 world cities: Delhi, India (24.9 million); Jakarta, Indonesia (30.5 million); and Tokyo-Yokohama, Japan (37.8 million).
- 2019 - 303,054 babies born to 298,567 mothers in Australia. More than 30% of perinatal deaths were caused by a congenital anomaly. There were 17 maternal deaths, or 6 deaths per 100,000 women giving birth. Every day in Australia, 6 babies are stillborn and 2 die within 28 days of birth (neonatal death) 1 in 3 (36%) mothers had a caesarean section.
- 2016 - (0.33% of the world), and listed as number 52, about the population of North Korea, Mozambique or Taiwan. It used to be (2014) about that of Romania which has recently declined.
- Population density by country is listed 236 (3.14/km²) about that of Iceland (3.24/km²).
Over the last 30 years there has been a decrease in teenage women having children, with most women now have children when they are older (28-31 age), but older women (40+) are also decreasing. The births text excerpt below is an analysis of birth trends this century in Australia from Australia Now (ABS).
A separate body, Australian Institute of Health and Welfare (AIHW) National Perinatal Statistics Unit, also keeps accurate Australia-wide statistics on birth related issues including assisted reproductive technologies and major congenital malformations in Australia.
Medical Undergraduate discussion of this data occurs in the BGD Tutorial - Applied Embryology and Teratology.
| Statistics Links: Introduction | Reports | World Population | World Fertility | World Infant Mortality | Maternal Mortality | Australia | Brazil | Canada | China | Germany | India | Indonesia | Europe | Myanmar | Netherlands | Spain | United Kingdom | Romania | Uganda | United States | BGD Tutorial - Applied Embryology and Teratology | National Perinatal Statistics Unit | AIHW | Category:Statistics | |
|
| Australian Population Clock - 25,278,727 |
|---|
| On 5 March 2019 at 10:36:24 AM (Canberra time), the resident population of Australia is projected to be:
|
| Australia and the World (2010)
Population Growth Rate | Fertility Rate | AUS, CHN, IND, IDN, USA | World Growth |
Assisted Reproductive Technology
- Assisted Reproductive Technology in Australia and New Zealand
2019
2018
2017
2015
2014
2013
2012
2011
2010
2009


2020
Stillbirths and neonatal deaths in Australia 2017
Stillbirths and neonatal deaths in Australia 2017 (28 Jul 2020)[1]
"In 2017, in Australia, 2,924 babies died in the perinatal period. Three-quarters (2,173) were stillbirths and the remaining 751 were neonatal deaths.
- Every day in Australia, 6 babies are stillborn and 2 die within 28 days of birth (neonatal death).
- More than 30% of perinatal deaths were caused by a congenital anomaly.
- Nearly 2 in 5 perinatal deaths (39%) occurred before 22 completed weeks gestation.
- There were 9.6 perinatal deaths for every 1,000 births in 2017.
Maternal deaths in Australia 2015-2017
Maternal deaths in Australia 2015-2017[2]
- the maternal death rate in Australia was 6.4 deaths per 100,000 women giving birth, which is among the lowest rates in the world.
- The most common causes of maternal death were suicide and cardiovascular disease.
- The incidence of maternal death in Aboriginal and Torres Strait Islander women was more than 3 times as high as that for non-Indigenous women.
- More than 1 in 3 maternal deaths occurred in women who were aged 35 or over.
The Maternal Mortality Rate (MMR) continues to be higher among women who:
- identified as being Aboriginal or Torres Strait Islander
- were aged 35 and over
- had a body mass index (BMI) of 30 or more
- had given birth 4 or more times
- smoked in the first 20 weeks of pregnancy.
Incidence of insulin-treated diabetes in Australia

Incidence of insulin-treated diabetes in Australia
- 17,000 people started insulin to manage their type 2 diabetes—4,200 cases per 100,000 people with type 2 diabetes.
- 1,700 (60%) people diagnosed with type 1 diabetes were aged under 25.
- Just over 2,800 people were diagnosed with type 1 diabetes—12 cases per 100,000 population.
- In 2018, about 31,300 people began using insulin to treat their diabetes in Australia.
- 10,800 (34%) females began using insulin to treat gestational diabetes.
- Links: maternal diabetes
2019

NSW Mothers and Babies 2018
- births in NSW fell from 97,325 in 2014 to 95,552 in 2018, an overall decrease of 1.8%.
- largest percentage decrease occurred in the Far West Local Health District, where the number of births decreased by 14.8% between 2014 and 2018.
- In 2018, 56.6% of mothers were in the healthy weight range, 25.0% were overweight and 14.6% were obese. The rate of overweight and obesity among mothers was 39.6%.
- rate of normal vaginal birth decreased from 56.3% in 2014 to 53.6% in 2018.
- caesarean section rate increased from 32.2% to 34.5%
- rate of instrumental birth remained steady at just under 12%.
- percentage of babies born prematurely has been stable for the last five years. In 2018, 7.7% of babies were born prematurely.
- rate of low birth weight (less than 2,500 grams) has remained stable, ranging from 6.3% in 2014 to 6.8% in 2018.
- 2014–2018 the perinatal mortality rate varied from 7.5 to 8.4 per 1,000 births and was 8.1 per 1,000 in 2018. (771 perinatal deaths in 2018)
- In 2018, 77.2% of all reported perinatal deaths were stillbirth and perinatal deaths and 22.8% were neonatal deaths.

Congenital heart disease in Australia
Report (07 Nov 2019)[4]
Globally, congenital heart disease affects around 9 in every 1,000 babies born. In Australia, a large number of children, young people and adults live with congenital heart disease. This report presents latest statistics and trends on the incidence of congenital heart disease, and on hospitalisation and mortality.
- There were almost 5,000 congenital heart disease hospitalisations in 2016–17.
- There were 70 infant deaths from congenital heart disease in 2017, comprising 6.9% of all infant deaths.
- Around 9 in every 1,000 live births are affected by congenital heart disease.
- Advances in paediatric cardiac care has led to more adults living with congenital heart disease.
- Links: cardiovascular abnormalities
Hearing health outreach services for Aboriginal and Torres Strait Islander children in the Northern Territory - July 2012 to December 2018
Report (16 October 2019)[5]
- 47% of Indigenous children who received a service had hearing loss
- 57% of Indigenous children who had hearing loss at their first service showed improvement at their last service
- Links: hearing test
Stillbirths and neonatal deaths in Australia 2015 and 2016
Report (4 July 2019)[6]
- In 2015 and 2016, 623,701 babies born in Australia to 614,515 women
- Approximately 6 stillbirths and 2 neonatal deaths occur each day
- Almost 30% of perinatal deaths were caused by congenital anomaly
- 5,702 perinatal deaths (4,263 stillbirths and 1,439 neonatal deaths)
- 9.1 perinatal deaths per 1,000 births (6.8 stillbirths per 1,000 births and 2.3 neonatal deaths per 1,000 live births).
Australia's mothers and babies 2017—in brief
Australia's mothers and babies 2017—in brief [27 June 2019][7]
- In 2017, 301,095 women gave birth in Australia, an increase of 4.0% since 2007.
- 30.6 was the verage age of all women who gave birth, compared with 29.9 in 2007.
- 13% of women who gave birth in 2017 had gestational diabetes
- 1 in 3 mothers had a caesarean section in 2017
- 6.7% of liveborn babies were low birthweight in 2017
Australia's mothers and babies data visualisations [27 June 2019]
- Explore the characteristics and health of mothers and their babies through interactive data visualisations, including in-depth information and trends on the antenatal period, labour, birth and babies outcomes at birth.
2018

2017

2016
2015
2014
2013
2012

2011
2010
2009
| Australia’s mothers and babies: 2017 | 2016 | 2015 | 2014 | 2013 | 2012 | 2011 | 2010 | 2009 | 2008 | 2007 | National Perinatal Statistics Unit | AIHW | Australian Statistics | birth |
Incidence of insulin-treated diabetes in Australia

The Incidence of insulin-treated diabetes in Australia web report[8] presents the latest available data on new cases of type 1 diabetes and insulin-treated type 2 diabetes, and is part of the ongoing national reporting using the 2017 National (insulin-treated) Diabetes Register.
New cases of insulin-treated diabetes in 2017
According to the NDR, in 2017 there were 29,797 people who began using insulin to treat their diabetes:
- 9,053 (30%) women began using insulin to treat gestational diabetes
- 2,742 (9%) people were diagnosed with and began using insulin to treat type 1 diabetes
- 17,358 (58%) people began using insulin to treat type 2 diabetes
- 517 (2%) people began using insulin to treat other forms of diabetes.
- Links: gestational diabetes
Cervical screening in Australia 2019
Cervical screening in Australia 2019[9]
Cervical cancer cases and deaths were low by international standards
- In 2015, 727 women aged 20–69 were diagnosed with cervical cancer, and 140 died from the disease in 2017. This is equivalent to 9 new cases of cervical cancer diagnosed, and 2 deaths, per 100,000 women. These rates are similar to those for previous years.
- Both incidence and mortality halved between the introduction of the NCSP in 1991 and the year 2002 and have since remained at 9–10 new cases, and 2 deaths, per 100,000 women.
More than 5 in 10 women participated in cervical screening
- Between 1 January 2016 and 30 June 2017, 2,973,370 women participated in cervical screening. This was estimated to be around 54%–56% of women aged 20–69. (This estimate does not include the final 4 months of the previous NCSP and should not be extrapolated for the period 1 January 2016 to 30 November 2017.)
- Participation varied across remoteness areas—it was highest in Inner regional areas at 57% and lowest in Very remote areas at 46%. There was a clear association between participation and socioeconomic group—at 50% for women living in the lowest socioeconomic areas and 62% for women living in the highest socioeconomic areas.
Relatively few women rescreened early, and a third responded to a reminder
- Only 10% of women with a negative screen (that is, no abnormalities were detected) in 2015 rescreened earlier than the recommended 2 years, continuing a favourable downward trend. Of the more than 1 million women sent a 27-month reminder letter by a cervical screening register in 2016, 31% rescreened within 3 months, similar to the figure for previous years.
High-grade abnormality detection rate continued to decline in young women
- Between January 2017 and June 2017, for every 1,000 women screened, 7 had a high-grade abnormality detected by histology, providing an opportunity for treatment before possible progression to cancer.
- The rate of detection of high-grade abnormalities for women aged under 30 has declined. This effect is most likely a result of girls who were vaccinated against human papillomavirus (HPV) under the National HPV Vaccination Program moving into the screening cohort, leading to declines in the occurrence (and hence detection) of high-grade abnormalities.
Indigenous women had lower screening rates and poorer outcomes
- Incidence of cervical cancer in Aboriginal and Torres Strait Islander women is more than 2 times that of non-Indigenous women, and mortality more than 3 times the non-Indigenous rate. National cervical screening rates for Indigenous women are not available, as Indigenous status information is not collected on pathology forms in all jurisdictions, however there is evidence from a range of sources that Indigenous women are under-screened.
Background
- In April 2007, Australia introduced the National HPV Vaccination Program, which included an ongoing program for girls aged 12–13 and a ‘catch-up’ program for females aged 14–26. This program was extended to males from February 2013. By protecting vaccinated women from infection with the oncogenic HPV types that cause the majority of cervical cancer, the National HPV Vaccination Program is expected to reduce the number of cervical abnormalities and, eventually, the incidence of cervical cancer.
- On 28 April 2014, the Medical Services Advisory Committee (MSAC) announced its recommendations for a renewed NCSP. These recommendations included 5-yearly cervical screening of HPV-vaccinated and unvaccinated women aged 25–69, using a primary HPV test with partial HPV genotyping and reflex liquid-based cytology (LBC) triage, followed by exit testing of women aged 70–74 (MSAC 2014). These recommendations were accepted, and the current NCSP commenced on 1 December 2017.
- This report, however, is the final monitoring report of the previous NCSP that used Pap tests as the screening tool, presenting data for women screened between 1 January 2016 and 30 June 2017, and as such uses the target age group 20–69 and performance indicators for the previous NCSP.
- Links: cervical cancer
Physical activity during pregnancy 2011–12

This report looks at the types and amount of physical activity undertaken by women during pregnancy using the Australian Bureau of Statistics’ Australian Health Survey 2011–12. It compares activity levels for pregnant and non-pregnant women of the same ages and assesses these levels against the Australian physical activity guideline for adults.[10]
- Only 3 in 10 pregnant women met the physical activity guideline
- When assessed against the Australian physical activity guideline for adults, 30% of pregnant women were sufficiently active, 54% were insufficiently active and 16% were inactive.
- In comparison, just under half (47%) of women in the same age group who were not pregnant met the physical activity guideline for sufficient activity.
- Two-thirds of pregnant women were active for fewer than 150 minutes per week
- The median length of time spent on physical activity in the last week by pregnant women was 90 minutes. This was much lower than the average (mean) time of 151 minutes due to skewness caused by a small proportion of very active pregnant women.
- The average of 151 minutes for pregnant women was made up of just under an hour (54 minutes) of walking for fitness, 73 minutes of walking for transport and 24 minutes on moderate and vigorous activities.
- In comparison, the median length of time spent on physical activity in the last week for women who were not pregnant was 149 minutes and the average (mean) was nearly 4 hours (224 minutes). These women spent a similar amount of time walking for fitness and transport, with an extra 50 minutes on moderate and vigorous activities.
- Just over half of pregnant women exercised for fitness, usually walking
- While only 30% of pregnant women met the physical activity guideline, more than half (56%) did undertake some exercise specifically for fitness, recreation or sport. Of the pregnant women who exercised, one-third (34%) walked as their only form of exercise, 14% undertook some moderate activity (apart from walking) and 7% participated in some vigorous activity.
- In comparison, around two-thirds (66%) of women who were not pregnant exercised for fitness, recreation or sport. Women who were not pregnant were less likely than pregnant women to walk as their only form of exercise (21%), and much more likely to do some vigorous activity (31%).
Diabetes in pregnancy 2014–2015

The Diabetes in pregnancy 2014–2015 report[11] examines the short-term impact of pre-existing diabetes (type 1 or type 2) and gestational diabetes on mothers in pregnancy and their babies between 2014 and 2015. The report analyses data from the Australian Institute of Health and Welfare National Perinatal Data Collection.
- Diabetes affects nearly 1 in 10 pregnancies - In the 2-year period from 2014–2015, more than 45,000 mothers who gave birth in Australia (excluding Victoria) had diabetes, representing about 9.9% of all births recorded in the National Perinatal Data Collection (NPDC). Of those, about 40,500 (8.9%) had gestational diabetes, and 4,700 (1.0%) had pre-existing diabetes.
- Mothers with pre-existing diabetes were at highest risk of adverse effects
- Compared with mothers with no diabetes in pregnancy, mothers with pre-existing diabetes and gestational diabetes had higher rates of caesarean section, induced labour, pre-existing and gestational hypertension, and pre-eclampsia. They also had longer antenatal and postnatal stay in hospital (5 or more days).
- Mothers with gestational diabetes experienced complications at a lower rate than mothers with pre-existing diabetes.
- Babies of mothers with pre-existing diabetes were at highest risk of adverse effects
- Compared with babies of mothers with gestational diabetes or no diabetes, babies of mothers with pre-existing diabetes had higher rates of pre-term birth, stillbirth, low and high birthweight, low Apgar score, resuscitation, and special care nursery/ neonatal intensive care unit admission, and stayed longer in hospital.
- Babies of mothers with gestational diabetes had higher rates of complications than babies of mothers with no diabetes, but showed similar levels of risk as babies of mothers with no diabetes for high birthweight and low Apgar score.
- Having diabetes in pregnancy increased the risk of complications among some population groups
- Among Aboriginal and Torres Strait Islander mothers, the incidence of some complications occurred at a greater rate among mothers with pre-existing diabetes than among mothers with no diabetes. Babies of Indigenous mothers with pre-existing and gestational diabetes also experienced greater rates of complications than babies of Indigenous mothers with no diabetes.
- In Remote/Very remote areas, mothers with pre-existing and gestational diabetes and their babies experienced greater rates of some complications than mothers with no diabetes and their babies.
See also Reporting Diabetes pregnancy[12]
Maternal Vaccination
The Safety of Influenza and Pertussis Vaccination in Pregnancy in a Cohort of Australian Mother-Infant Pairs, 2012-2015: The FluMum Study[13] "Inactivated influenza vaccine (IIV) and pertussis vaccination are recommended in pregnancy. Limited safety data exist for women who received IIV vaccine during the first trimester of pregnancy or received both vaccines in pregnancy. We assessed adverse birth outcomes between vaccinated and unvaccinated pregnancies. METHODS: Among prospectively enrolled Australian "FluMum" participants (2012-2015), primary exposure was receipt and timing of IIV during pregnancy. Primary outcomes included preterm birth, low birthweight at term (LBWT), and small for gestational age (SGA). We compared birth outcomes for IIV in pregnancy with women unvaccinated in pregnancy using Cox proportional hazard ratios (HRs) with 95% confidence intervals (CIs). ...No significant associations were found between maternal IIV or pertussis vaccination in pregnancy and adverse birth outcomes, regardless of the trimester of pregnancy a vaccination was given compared to unvaccinated pregnancies."
Gastroenteritis
Perinatal Risk Factors Associated With Gastroenteritis Hospitalizations in Aboriginal and Non-Aboriginal Children in Western Australia (2000-2012): A Record Linkage Cohort Study[14] "Gastroenteritis is a leading cause of childhood morbidity worldwide. We aimed to assess the maternal and infant characteristics and population attributable fractions associated with childhood gastroenteritis-related hospitalizations. METHODS: We conducted a whole-of-population retrospective birth cohort study of 367,476 children live-born in Western Australia 2000-2012. We identified hospital admissions up to <15 years of age pertaining to these children, with a principal diagnosis code for infectious gastroenteritis. Cox regression was used to obtain the adjusted hazard ratios with 95% confidence intervals and the population attributable fractions associated with each risk factor in Aboriginal and non-Aboriginal children for their first gastroenteritis-related hospital admission. ...Given the beneficial effect of infant rotavirus vaccination in preventing all-cause gastroenteritis hospitalization, efforts should be taken to optimize rotavirus vaccine coverage in those at highest risk."
intrauterine Growth Restriction
Human papillomavirus infection and intrauterine growth restriction: a data-linkage study[15] "Using unbiased population data, to examine whether having a positive Pap smear, and thus a high probability of Human Papilloma Virus (HPV) infection, is a significant risk factor for intrauterine growth restriction (IUGR) in a subsequent pregnancy. STUDY DESIGN AND METHODS: Two independent population-based databases, namely the South Australian Perinatal Statistics Collection and the South Australian Cervical Screening Database, were deidentified and linked by the SANT Datalinkage Service. Analyses were performed on cases where Pap smear screening data was available for up to 2 years prior to a singleton live birth. Population characteristics and pregnancy related data were compared statistically by normal birth weight versus IUGR (10th percentile - known as small for gestational age (SGA), small for gestational age) and (3rd percentile birth weight - known as VLBW, very low birth weight). The association between cervical screening results and IUGR was assessed using generalized linear log binomial regression models. RESULTS: A total of 31,827 women met the criteria. Of these, 1311 women (4.1%) had a positive Pap smear within 2 years of the current pregnancy. Those having a positive Pap smear were more likely to have a baby with IUGR than those with negative smear results. For SGA, 5.8% babies were from mothers with positive Pap smears compared to 4.0% with negative smears indicating a 40% higher risk of having an SGA baby (95%CI 20-70%) among women with positive Pap smears. For VLBW, 7.6% mothers had positive Pap smears compared with 4.0% with negative smears (p < .001), which reflects a 90% increased risk (95%CI 40-150%). These associations reduced to 20% (95%CI 1-40%) and 50% (95%CI 10-100%) for SGA and VLBW, respectively, after adjusting for all other significant covariates including maternal age, ethnicity, marital status, occupation, smoking, pregnancy history, and maternal health during pregnancy. CONCLUSIONS: Mothers with a positive Pap smear have an increased risk of IUGR, especially for VLBW, which is independent of other risk factors. The results confirm previous findings in a small study and emphasise the need to consider the risks of both cancer and IUGR in all HPV vaccination programs."
- Links: viral | vaccination | Fetal Growth Restriction
2018
Screening for spinal muscular atrophy
Spinal muscular atrophy SMA added to newborn heel prick (Guthrie test)[16] in 'profound' change in medical screening "In an Australian first, newborn babies are now being routinely screened for the genetic condition SMA, or spinal muscular atrophy". SMA leads to a loss of motor neurons and progressive muscle wasting and has several different forms: Type 1, Type 2, and Type 3a SMA.
- Links: ABC News
National Core Maternity Indicators
National Core Maternity Indicators[17]
- "The National Core Maternity Indicators (NCMI) present information on measures of clinical activity and outcomes. The purpose of the NCMIs is to assist in improving the quality of maternity services in Australia by establishing baseline data for monitoring and evaluating practice change. These indicators cover data for the majority of women who gave birth in Australia from 2004 to 2016 and are grouped into 3 broad topic areas—antenatal period, labour and birth and birth outcomes."
- 1 in 5 women having their first baby vaginally without instruments had an episiotomy in 2016.
- 1 in 4 (26%) selected women had an instrumental vaginal birth for their first birth.
- almost 30% of selected women giving birth for the first time had a caesarean section.
MyHealthyCommunities - Child and maternal health in 2014–2016
- "Four key maternal and child health indicators have been updated in this release — smoking during pregnancy, child and infant mortality, low birthweight babies, and antenatal visits in the first trimester of pregnancy. Indicators are reported nationally, by Primary Health Network (PHN) areas and by smaller local areas."
- The proportion of women who reported smoking during pregnancy was 10.4%.
- Regional PHN areas had an infant and young child mortality rate 1.3 times the rate of metropolitan PHN areas.
- The proportion of low birthweight babies was 5.0% with little difference between metropolitan and regional PHN areas.
Australia’s mothers and babies 2016—in brief
Australia’s mothers and babies 2016—in brief[18]
- In 2016, 310,247 women gave birth in Australia — an increase of 12% since 2006 (277,440 women).
Perinatal deaths in Australia 2013–2014
Australian Institute of Health and Welfare 2018. Perinatal deaths in Australia: 2013–2014. Cat. no. PER 94. Canberra: AIHW.
Teenage mothers in Australia 2015

Australian Institute of Health and Welfare 2018. Teenage mothers in Australia 2015. Cat. no. PER 93. Canberra: AIHW. Online Report
"Teenage mothers and their babies are more likely to experience broader disadvantage, have antenatal risk factors and have poorer maternal and baby outcomes during and after birth, than older mothers and their babies."
- Rate of teenage births has decreased between 2005 and 2015, from 17.5 births per 1,000 women to 11.4.
- 8,268 babies were born to 8,203 teenage mothers aged less than 20, accounting for 2.7% of all mothers.
- Babies of teenage mothers were 1.2 times as likely to be preterm than babies of 20-24 year old mothers
- Babies of teenage mothers were 1.3 times as likely to be of low birthweight than babies of 20-24 year old mothers.
- 1 in 4 teenage mothers smoked after 20 weeks of pregnancy.
Pelvic Inflammatory Disease and Ectopic Pregnancy
Rates of pelvic inflammatory disease and ectopic pregnancy in Australia, 2009-2014[19]
- Calculated yearly PID and EP diagnosis rates in three states (Victoria, New South Wales, Queensland) for women aged 15-44 years using hospital admissions and emergency department (ED) attendance data, with population and live birth denominators. * Ectopic Pregnancy - in 2014 the rate of all admissions was 17.4 (95% CI 16.9 to 17.9) per 1000 live births and of all ED presentations was 15.6 (95% CI 15.1 to 16.1). Comparing 2014 with 2009, the rates of all EP admissions (aIRR 1.06, 95% CI 1.04 to 1.08) and rates in EDs (aIRR 1.24, 95% CI 1.18 to 1.31) were higher.
- Pelvic Inflammatory Disease and EP remain important causes of hospital admissions for female STI-associated complications. Hospital EDs care for more PID cases than inpatient departments, particularly for young women." Australian statistics
The Clinical Practice Guidelines: Pregnancy Care

Clinical Practice Guidelines - Pregnancy Care Guidelines released 5 Feb 2018.[20]
- The Clinical Practice Guidelines: Pregnancy Care (the Guidelines) continue the process of providing high quality evidence-based guidance to maternity service providers and the consumers of their care. This process started in 2008 with the development of Module I (Clinical Practice Guidelines: Antenatal Care), and its subsequent release in 2012. This was followed by Module II, which was released in 2014.
- This edition brings together the two previous modules and contains updates of a number of topics from them, including weight and body mass index (weight monitoring reviewed), fetal growth and wellbeing, risk of preterm birth, risk of pre-eclampsia (risk factors and prediction reviewed), family violence, hyperglycaemia (early testing reviewed), hepatitis C, thyroid dysfunction, vitamin D status and chromosomal anomalies (cell- free DNA testing reviewed). The new topic substance use has also been incorporated.
- The Guidelines were developed to help ensure that women in Australia are provided with consistent, high- quality, evidence-based maternity care. The Guidelines are intended for all health professionals who contribute to pregnancy care including midwives, obstetricians, general practitioners, Aboriginal and Torres Strait Islander health workers and allied health professionals. (from summary page)
2017
Australia’s mothers and babies 2015—in brief
Australia’s mothers and babies 2015—in brief[21]
|
|
Report - Health expenditure Australia 2015–16
- Australia total spending on health in was $170.4 billion in 2015-16[22]
- $6.0 billion (3.6%) higher in real terms than in 2014-15.
- Due to low GDP growth, health’s share of GDP has risen to 10.3%.
- Link: AIHW Dynamic Report page

Incidence of insulin-treated diabetes in Australia 2015
This fact sheet published in 2017[23] provides the latest available national data on new cases of insulin-treated diabetes in Australia.
It shows that in 2015 there were 28,775 people who began using insulin to treat their diabetes in Australia:
- 63% had type 2 diabetes
- 26% (18,142) had gestational diabetes
- 9% had type 1 diabetes
- 2% had other forms of diabetes or their diabetes status was unknown.
In 2015, 7,405 women began using insulin to manage gestational diabetes—130 cases per 100,000 women of reproductive age (15–49 years), or around 1 in every 800 women aged 15–49. This represents almost 1 in 4 (24%) women diagnosed with gestational diabetes aged 15–49 in 2015.
Gestational diabetes occurs when higher than normal blood glucose is diagnosed for the first time during pregnancy. It generally occurs in the second or third trimester, among women who have not previously been diagnosed with other forms of diabetes.
- Links: AIWH Factsheet
Aboriginal Mortality and Life Expectancy 1967-2012
Progress in closing the gap in life expectancy at birth for Aboriginal people in the Northern Territory, 1967-2012[24]
OBJECTIVES: To compare long term changes in mortality and life expectancy at birth (LE) of Aboriginal people in the Northern Territory and of the overall Australian population; to determine the contributions of changes in mortality in specific age groups to changes in LE for each population.
DESIGN, SETTING, PARTICIPANTS: Retrospective trend analysis of death and LE data for the NT Aboriginal and Australian populations, 1967-2012.
MAIN OUTCOME MEASURES: LE estimates based on abridged life tables; mortality estimates (deaths per 100 000 population); and age decomposition of LE changes by sex and time period.
RESULTS: Between 1967 and 2012, LE increased for both NT Aboriginal and all Australians; the difference in LE between the two populations declined by 4.6 years for females, but increased by one year for males. Between 1967-1971 and 1980-1984, LE of NT Aboriginal people increased rapidly, particularly through reduced infant mortality; from 1980-1984 to 1994-1998, there was little change; from 1994-1998 to 2008-2012, there were modest gains in older age groups. Decomposition by age group identified the persistent and substantial contribution of the 35-74-year age groups to the difference in LE between NT Aboriginal people and all Australians.
CONCLUSIONS: Early gains in LE for NT Aboriginal people are consistent with improvements in nutrition, maternal and infant care, and infectious disease control. A rapid epidemiological transition followed, when LE gains in younger age groups plateaued and non-communicable diseases became more prevalent. Recent LE gains, across all adult age groups, are consistent with improved health service access and chronic disease management. If LE is to continue improving, socio-economic disadvantage and its associated risks must be reduced.
NSW Mothers and Babies 2015 Report


NSW is one of the largest states in Australia by population. The New South Wales Perinatal Data Collection (PDC) is a population-based surveillance system covering all births in NSW public and private hospitals, as well as home births. It encompasses all live births, and stillbirths of at least 20 weeks gestation or at least 400 grams birth weight.[25]
- The number of births in NSW fell from 97,245 in 2011 to 96,391 in 2015, an overall decrease of 0.9%.
- The percentage of mothers who were teenagers fell from 3.2% in 2011 to 2.5% in 2015.
- The rate of normal vaginal birth decreased from 56.9% in 2011 to 56.0% in 2015.
- Operative and instrumental births were more common among privately than publicly insured mothers.
- The proportion of mothers reporting any smoking during pregnancy declined from 11.1% in 2011 to 8.9% in 2015.
- In 2015, the majority of mothers planned to give birth in a hospital labour ward, and 2.5% of mothers planned to give birth in a birth centre.
- Eighty-seven per cent of mothers who planned to give birth in a birth centre actually did so.
- There were 187 homebirths in NSW reported in 2015.
- In 2015, 7.9% of babies were born prematurely (less than 37 weeks gestation), a slight increase from 7.5% in 2011.
- Since 2011, the rate of low birth weight (less than 2,500 grams) has remained stable, ranging from 6.1% to 6.6%.
- The rate of low birth weight was 6.6% in 2015.
- Between 2011 and 2015, the reported number of Aboriginal or Torres Strait Islander mothers giving birth increased from 2,975 to 3,823, an increase from 3.1% to 4.0% of all mothers.
- The percentage of Aboriginal or Torres Strait Islander mothers who were teenagers fell from 19.0% in 2011 to 15.4% in 2015.
- In 2015, 45.0% of Aboriginal or Torres Strait Islander mothers reported smoking at some time during pregnancy.
- Since 2011, rates of low birth weight and prematurity in Aboriginal or Torres Strait Islander babies has been over 11%. In 2015, 11.3% of Aboriginal or Torres Strait Islander babies were low birth weight and 12.7% were premature.
- The perinatal mortality rate of 9.6 per 1,000 births in Aboriginal or Torres Strait Islander mothers in 2015 is higher than the rate of 8.1 per 1,000 births experienced among babies born to non-Aboriginal or Torres Strait Islander mothers.
- Links: NSW Health Link page | Report PDF
2016
Australia's mothers and babies 2014

- In 2014, 307,844 women gave birth in Australia—an increase of 18% since 2004 (252,871)[26]
- The rate of women giving birth increased from 59 per 1,000 women of reproductive age (15–44 years) in 2004 to 63 per 1,000 in 2014.
- The average age of all women who gave birth continues to rise and was 30.2 in 2014,
- The proportion of mothers aged 35 and over has increased from 20% in 2004 to 22% in 2014.
- The proportion of mothers aged under 25 has decreased from 19% to 16%.
- There were 312,548 babies born in 2014—an increase of 18% since 2004.
Australian Burden of Disease Study 2011
There were 4.5 million years lost to premature death or living with illness in Australia in 2011. This was based on an analyses of the impact of nearly 200 diseases and injuries in terms of their fatal and non-fatal burden for the Australian population. Most of the burden was from chronic diseases and injuries. [27]
Five disease groups that caused the most burden:
- cancer (19%)
- cardiovascular diseases (15%)
- mental and substance use disorders (12%)
- musculoskeletal conditions (12%)
- injuries (9%).
Chronic diseases accounted for 61% of the total burden. At the specific disease level, coronary heart disease, other musculoskeletal conditions, back pain and problems, chronic obstructive pulmonary disease (COPD) and lung cancer caused the most burden.
National Core Maternity Indicators stage 3 and 4 results from 2010–2013
(19 Jul 2016)
"The National Core Maternity Indicators (NCMIs) present information on measures of clinical activity and outcomes between 2004 and 2013. The purpose of the NCMIs is to monitor the safety and quality of maternity care to ensure that there is continual improvement in the quality of maternity services following the introduction of the National Maternity Services Plan (AHMC 2011). This report covers 10 indicators previously reported and 2 new indicators. Data are presented by jurisdiction, at the national level by hospital annual number of births, hospital sector, and mother's Indigenous status. Some indicators are presented by remoteness, disadvantage quintile and other disaggregations where relevant. From the 12 indicators, the following observations can be made."[28]
Antenatal period 2013:
- fewer than 1 in 8 women (34,000 or 11.2%) smoked in the first 20 weeks of pregnancy
- a decrease from 12.7% in 2011, and around one-quarter quit smoking after the first 20 weeks of pregnancy.
- around 26,000 (73.6%) women who previously reported smoking continued to smoke after the first 20 weeks of pregnancy, an increase from 2011.
- proportion of women receiving antenatal care in the first trimester remained steady.
During labour and birth:
- first-time mothers for whom labour was induced increased by 5 percentage points from 31.1% in 2004 to 36.1% in 2013.
- may reflect increasing maternal age and the pre-existing medical conditions that may have prevented the spontaneous onset of labour.
- 2004 to 2013 - rate of unassisted vaginal births decreased while assisted vaginal births increased.
- 2013 - one-fifth of women (almost 11,000 or 18.4%) received an episiotomy in an unassisted birth an increase of 2.2 percentage points from 16.2% in 2004.
- around two-thirds of women (around 21,000 or 69.6%) received an episiotomy in an assisted birth, an increase of 8.9% percentage points from 60.7% in 2004.
- rate of caesarean sections in first-time mothers increased from 25.3% in 2004 to 27.5%
- in 2013 an increase of 2.2 percentage points - consistent with increasing trends observed in other developed countries.
- around 1 in 8 women (about 3,400 or 13.5%) had a second birth vaginally after having their first birth by caesarean section
- an increase of 0.4 percentage points from 13.1% in 2007.
Birth outcomes 2013:
- 1.3% of babies (3,800) had an Apgar score of less than 7 at 5 minutes, an increase of 0.4 percentage points from 0.9% in 2004
- may be associated with maternal risk factors such as increasing maternal age and increasing maternal obesity.
- decrease in the proportion of small babies born at or after term by 0.5% from 2.1 percentage points in 2004 to 1.6% in 2013.
- Links: AIHW report page
Poisoning in children and young people 2012–13
"almost half (49%) of all cases occurred among 18-24 year olds, and a quarter among 15-17 year olds (26%). The highest rate of poisoning by pharmaceuticals was seen in 15–17 year old girls (589 cases per 100,000)."[29]
- Links: Abnormal Development - Drugs

Monitoring the health impacts of mandatory folic acid and iodine fortification 2016
Decrease in neural tube defects since folic acid added to bread[30]
- Mandatory fortification of bread with folic acid (in Australia) and iodine (in Australia and New Zealand) was introduced in 2009
- Overall decrease in the rate of neural tube defects (NTDs) by 14.4%
- Teenagers the rate of NTDs decreased by almost 55%
- Aboriginal and Torres Strait Islander women the rate of NTDs decreased by 74%
Nursing and midwifery workforce 2015 Report
- Total number of all nurses and midwives registered in Australia increased from 330,680 in 2011 to 360,008 in 2015 (8.9%).
- in 2015, 91.9% of all registered nurses and midwives were in the nursing and midwifery workforce (331,015).
- 8,930 were looking for work in nursing and midwifery, down from 9,110 in 2014.
- In 2015, the overall supply of employed nurses and midwives was 1,138 full-time equivalents or FTEs for every 100,000 people.
- This compares with the figure of 1,107 FTEs per 100,000 in 2011.
- In 2011 and 2015, there were more employed nurses and midwives in the 50-54 year age group than any other age group.
- The proportion aged 50 and over grew from 38.3% in 2011 to 39.0% in 2015. The proportion in 2014 was 39.4%."
Pertussis NSW
| Pertussis - (whooping cough) There has been a recent significant increase in the total number of pertussis (whooping cough) notifications in NSW. |

|
2015

Australian Immunisation Handbook
The purpose of The Australian Immunisation Handbook[31] is to provide clinical guidelines for health professionals on the safest and most effective use of vaccines in their practice. These recommendations are developed by the Australian Technical Advisory Group on Immunisation (ATAGI) and endorsed by the National Health and Medical Research Council (NHMRC).
There is a specific section within the handbook for Vaccination of women planning pregnancy, pregnant or breastfeeding women, and preterm infants.

Breast cancer in young women
26 Oct 2015 Key facts about breast cancer in women in their 20s and 30s[32]
- In 2015, it is projected that 795 young women will be diagnosed with breast cancer and 65 will die from this disease.
- On average, this is more than 2 breast cancers diagnosed every day and more than 1 death every week.
- most commonly diagnosed cancer for women aged 20 to 39 and is associated with poorer survival outcomes.
- for women aged 40 and over, 40 new cases per day and 57 deaths per week-breast cancer.
- Overall, 5-year relative survival is significantly lower in younger women, who had an 88% chance of surviving for 5 years in 2007-2011 compared with the 5-year relative survival rate for women aged 40 and over of 90%. However, the 5-year relative survival rate has improved for young women, from 72% in 1982-1986 to 88% in 2007-2011.
- Links: Mammary Gland Development
Prevalence of type 1 diabetes among children aged 0–14 in Australia 2013
Prevalence of type 1 diabetes among children aged 0–14 in Australia 2013
Type 1 diabetes is a non-preventable lifelong autoimmune disease, which is most commonly diagnosed in children. It is a difficult condition to manage, and if left untreated or improperly managed, can lead to many health complications or death.
Ongoing, regular monitoring of type 1 diabetes is essential to improve Australia's ability to respond to this important health problem.
- In 2013, 6,091 children aged 0-14 had type 1 diabetes in Australia-representing 139 cases per 100,000 population, or about 1 in every 720 children in that age group.
- Rates of type 1 diabetes were similar for both boys and girls.
- Rates for children aged 10-14 were twice as high (278 cases per 100,000 population) as for children aged 5-9 (123 per 100,000), and more than 10 times as high as for children aged 0-4 (27 per 100,000).
- The Northern Territory had the lowest prevalence of type 1 diabetes in children (50 cases per 100,000 population), while Tasmania had the highest (166 per 100,000).
- Children living in Remote and very remote areas had the lowest prevalence of type 1 diabetes (82 cases per 100,000 population) compared with all other areas in Australia (where rates varied between 133 and 169 cases per 100,000 population).
- The prevalence of type 1 diabetes among children was relatively similar across socioeconomic groups.
- There were 167 Aboriginal and Torres Strait Islander children with type 1 diabetes-equating to 69 cases per 100,000 Indigenous children, or 1 in almost 1,500.
- Just over 2 in 5 children (43%) with type 1 diabetes used a pump to administer insulin.
- Links: Endocrine - Pancreas Development | Immune System Development | Diabetes Australia - Type 1 Diabetes
Health expenditure Australia 2013-14
Health expenditure Australia 2013-14[34]
- Total expenditure on health was estimated at $154.6 billion in 2013-14, up by 3.1% on 2012-13 in real terms. Growth in expenditure per person was $6,639, which was $94 more in real terms than in 2012-13. Despite this relatively slow growth, total expenditure was 9.8% of GDP in 2013-14, up from 9.7% in 2012-13.
- Governments provided $104.8 billion (or 67.8%) of total health expenditure, which represented about 25% of taxation revenue (unchanged from 2012-13).
- The non-government sector share of total expenditure increased from 30.0% in 2011-12 to 32.2% in 2013-14, despite generally falling throughout the decade. Funding by individuals was the fastest growing area of non-government sector expenditure over the decade.

Australian Health-care Structure and Funding[34]
2014
December

Australia’s mothers and babies 2012
This data summarised below is provided to help you as a clinician or researcher understand the current trends in reproductive medicine within Australia.
The information is based upon data from the publication "Australia's mothers and babies 2012"[35] and is provided for educational purposes only. The original full publication is available online from AIHW Perinatal statistics series no. 69.
In 2012, 307,474 women gave birth to 312,153 babies in Australia. This was an increase of 10,343 births (3.4%) from that reported in 2011, and a total increase of 21.5% since 2003. Nationally, the proportion of teenage mothers (younger than 20) declined from 3.7% in 2011 to 3.6% in 2011, compared with 4.6% in 2003.
Mothers
- The average maternal age in 2012 was 30.1 compared with 29.5 in 2003. Approximately 42% of women were having their first baby and the average age of first-time mothers was 28.4. Of all first-time mothers in 2012, 14% were aged 35 or older compared with 12% in 2003. Assisted reproductive technology (ART) was used by 4% of women who gave birth in the 5 jurisdictions for which data on ART were available.
Baby outcomes
- In 2012, 9% of babies were born pre-term (before 37 completed weeks of gestation) and 0.6% post-term (42 weeks gestation or more). Overall, 6% of liveborn babies were of low birthweight (less than 2,500 grams) and this doubled (12%) among mothers who smoked during pregnancy. One in 5 (20%) babies received some form of resuscitation at birth, although almost half (49%) received only suction or oxygen therapy.
November

Health indicators for Remote Service Delivery communities: a summary report.[36]
This report provides information on antenatal care, live births, low birthweight babies, hospitalisations (all and selected causes), disability, mortality, child protection, juvenile justice, alcohol and other drug use and aged care for 29 remote Indigenous communities. Where possible, data are presented at the jurisdictional and national level, and time series data provided for comparison. This information was compiled to inform an evaluation of the National Partnership Agreement on Remote Service Delivery (NPA RSD), conducted in 2013.
- "Aboriginal and Torres Strait Islander women have a higher overall fertility rate and teenage fertility rate than non-Indigenous women. The teenage fertility rate is an indicator of the health and wellbeing of mothers and children. Babies born to teenage mothers are more likely to be of low birth weight. Teenage pregnancy has also been associated with lower educational attainment, high unemployment, greater welfare dependency and lower levels of social and emotional wellbeing for both mothers and children."
- Links:Birth Weight
August
Gestational diabetes in a rural, regional centre in south Western Australia: predictors of risk[37]
Gestational diabetes mellitus (GDM) is the most common antenatal complication in Western Australia. Rural areas may be at greater risk due to poorer socioeconomic status, reduced healthcare access, increased obesity and greater Aboriginal population. This paper reviews the prevalence and risk factors of GDM and outcomes for pregnancies in a regional rural centre, with a view to predicting the risk of GDM in this population, given factors identified early in the pregnancy. ...Of 1645 women delivered at BRH in the study period, nine had pre-existing diabetes and were excluded. A further 73 (4.46%) developed GDM in the current pregnancy. ...These results confirm the known association of GDM with age; obesity, lower socioeconomic quintile and Asian ethnicity are also present in the rural population. The absence of association with Aboriginal ethnicity was not expected and is discussed.
- Links: Maternal Diabetes
Maternal deaths in Australia 2006-2010[38]
Over the five years 2006-2010, there were 99 maternal deaths in Australia according to the report, Maternal deaths in Australia 2006-2010. This equates to a rate of 6.8 deaths per 100,000 women who gave birth in Australia. While lower than the rates for the previous three year reporting period 2003-2005 (8.4 deaths per 100,000 women who gave birth), and 2000-2002 (11.1 deaths per 100,000 women who gave birth), trends should be interpreted with caution due to the small numbers and the rare occurrence of these deaths.
In 2006-2010 there were 39 direct maternal deaths and 57 indirect deaths. Three deaths were not able to be classified as direct or indirect.
- leading causes of direct maternal death included embolism (a blockage of major blood vessels) caused by amniotic fluid (accounting for 9 deaths) or blood clot (8), and haemorrhage (7).
- leading cause of indirect maternal death was cardiac disease (15 deaths), followed by deaths due to psychosocial morbidity (related to mental health and substance abuse issues) (13 deaths).
- women who died were aged between 17 and 45 years, with women aged over 40 being at higher risk of maternal death.
- A higher number of previous pregnancies was also associated with increased risk, as was residing in Remote or Very remote areas.
- Indigenous women were about three times as likely to die as non-Indigenous women, with a maternal mortality rate of 16.4 deaths per 100,000 women giving birth (9 deaths).
- Sepsis and cardiac conditions have been the leading causes of maternal death among Indigenous women over the period 1997 to 2010.
- Links: Maternal Mortality
June
Birthweight percentiles by gestational age for births following assisted reproductive technology in Australia and New Zealand, 2002-2010[39]
What is the standard of birthweight for gestational age for babies following assisted reproductive technology (ART) treatment? A total of 69 315 births (35 580 males and 33 735 females) following ART treatment were analysed for the birthweight percentile. Exact percentiles of birthweight in grams were calculated for each gestational week between Week 25 and 42 for fresh and thaw cycles by infant sex. Univariate analysis was used to determine the exact birthweight percentile values. Student t-test was used to examine the mean birthweight difference between male and female infants, between single embryo transfer (SET) and double embryo transfer (DET) and between fresh and thaw cycles.
Preterm births (birth before 37 completed weeks of gestation) and low birthweight (<2500 g) were reported for 9.7 and 7.0% of live born singletons following ART treatment. The mean birthweight was 3280 g for live born singletons following fresh cycles (3338 g for male infants and 3217 for female infants) and 3413 g for live born singletons following thaw cycles (3475 g for male infants and 3349 for female infants).
The comparison of birthweight percentile charts for ART births and general population births provide evidence that the proportion of SGA births following ART treatment was comparable to the general population for SET fresh cycles and significantly lower for thaw cycles. Both fresh and thaw cycles showed better outcomes for singleton births following SET compared with DET. Policies to promote single embryo transfer should be considered in order to minimize the adverse perinatal outcomes associated with ART treatment.
2013
December
Pregnancy And Neonatal Diabetes Outcomes in Remote Australia (PANDORA) Study[40]
- "Diabetes in pregnancy carries an increased risk of adverse pregnancy outcomes for both the mother and foetus, but it also provides an excellent early opportunity for intervention in the life course for both mother and baby. In the context of the escalating epidemic of chronic diseases among Indigenous Australians, it is vital that this risk is reduced as early as possible in the life course of the individual. The aims of the PANDORA Study are to: (i) accurately assess rates of diabetes in pregnancy in the Northern Territory (NT) of Australia, where 38% of babies are born to Indigenous mothers; (ii) assess demographic, clinical, biochemical, anthropometric, socioeconomic and early life development factors that may contribute to key maternal and neonatal birth outcomes associated with diabetes in pregnancy; and (iii) monitor relevant post-partum clinical outcomes for both the mothers and their babies."
- Links: Maternal Diabetes
March
National Core Maternity Indicators (data for 2004 through to 2009) - "Mixed trends for maternity indicators"
- higher proportion of women (80%) attending antenatal care during the first trimester.
- proportion of babies born weighing less than 2,750 grams at or after 40 weeks fell from 2.1% to 1.8% (indicates that very few exceptionally small babies are being missed during antenatal screening for poor fetal growth)
- episiotomy dropped from 16.2% to 15.1% for women giving birth without instruments.
- Rates of smoking in pregnancy in Australia also dropped-from 16.7% to 14.5%.
- induction, caesarean section and instrumental vaginal birth rates increased over the period among most groups of women.
- normal vaginal birth rates decreased proportionately.
2012
Data from Australia's health[41]
Health
- Life expectancy has increased dramatically over the last century and continues to increase. A boy born in 2008–2010 can expect to live 79.5 years and a girl 84.0 years.
- Life expectancy at birth for Aboriginal and Torres Strait Islander people is much lower than for non-Indigenous Australians—12 years lower for boys and 10 years for girls.
Fertility
- Fertility rates differ among women of different backgrounds. Indigenous women, women from areas of low socioeconomic status, and women with lower educational qualifications have higher fertility rates than the general female population.
- Australian clinics performed more than 65,000 assisted reproductive technology (ART) treatment cycles in 2009, an increase of 15% since 2008 and almost 50% since 2005. This represents about 3% of all women who gave birth in Australia in 2009.
Mothers and babies
- The age at which women are giving birth continues to rise: in 2009 the average age of all women who gave birth was 30.0 years, compared with 29.0 in 2000. This mainly reflects an increasing proportion of older mothers (aged 35 and over) giving birth.
- Low birthweight is a key determinant of a baby’s subsequent survival and health. In 2009, the proportion of babies born with low birthweight was twice as high for women who reported smoking in pregnancy as for women who did not.
Australian Bureau Statistics 2011

Births
- "There were 301,617 births registered in Australia in 2011, approximately 3,700 (1.2%) more than the number registered in 2010 (297,903). Just over half (51%) of all births registered in 2011 were male babies, resulting in a sex ratio at birth of 105.7 male births per 100 female births."
- "The median age of all mothers for births registered in 2011 was 30.6 years, while the median age of fathers was 33.0 years."
- "There were 17,621 births (6% of all births) registered in Australia during 2011 where at least one parent reported themselves as being an Aboriginal and/or Torres Strait Islander on the birth registration form."
Fertility
- "In 2011, Australia's total fertility rate (TFR) was 1.88 babies per woman, down very slightly from the 2010 TFR of 1.89 babies per woman. Since 1976, the total fertility rate for Australia has been below replacement level. That is, the average number of babies born to a woman throughout her reproductive life (measured by the TFR) has been insufficient to replace herself and her partner. The TFR required for replacement is currently considered to be around 2.1 babies per woman. The TFR reached a low of 1.73 babies per woman in 2001 before increasing to a thirty-year high of 1.96 babies per woman in 2008."
- "The median age of first-time mothers in 2011 was 28.9 years, 62% of whom were married at the time of giving birth."
Birth Statistics

This recent data summarised below from Australia's mothers and babies 2007[42] and 2008[43] is provided to help you as a clinician and researcher understand the current trends in reproductive medicine within Australia. Also see recent general population data in Australian Statistics.
Mothers

- 2007 289,496 women gave birth to 294,205 babies
- 2008 292,156 women gave birth to 296,925 babies
- 2007 increase of 4.3% from 2006, and 14.4% increase since 2004
- fetal death component was 2,177 and 2,188 respectively
- 29.9 years was the maternal mean age in 2007
- compared with 28.9 years in 1998 Why is this increasing age important?
- the rate of women aged 15–44 years giving birth in the population decreased slightly between 2007 and 2008.
- 41.6% of mothers had their first baby and 33.5% had their second baby
- 10,883 women were Aboriginal or Torres Strait Islander (3.8% of all women who gave birth)
- 39.5% of all mothers in the Northern Territory
- 25.2 years was the average age of these women who gave birth
- 3.1% women received ART treatment (see also below Assisted Reproduction Technology)
Babies
- 292,027 live births and 2,177 fetal deaths
- stillbirth rate of 7.4 per 1,000 births
- most births occurred in March, August and October
- 105.6 sex ratio (number of male per 100 female liveborn babies)
Gestational age
- 90.9% term (37–41 weeks gestation)
- 8.1% were preterm and 33.2 weeks was the mean gestational age for all preterm births
- Preterm births were classified groups of 20–27 weeks, 28–31 weeks and 32–36 weeks
Birthweight
- 92.1% of liveborn babies had a birthweight in the range 2,500–4,499 grams
- average birthweight was 3,374 grams
- 17,976 (6.2%) low birthweight (weighing less than 2,500 grams) (6.1% for 2008)
- 2,956 (1.0%) very low birthweight (weighing less than 1,500 grams)
- 1,288 (0.4%) extremely low birthweight (weighing less than 1,000 grams)
Apgar scores - 1.4% of liveborn babies had a low Apgar score (between 0 and 6) at 5 minutes (More? Apgar test)
Special care nurseries or neonatal intensive care units - 14.5% of liveborn babies were admitted to an SCN or NICU
Perinatal Mortality

- 2,177 fetal deaths (7.4 per 1,000 births)
- fetal deaths are if the birthweight is at least 400 grams or the gestational age is 20 weeks or more
- 846 neonatal deaths (2.9 per 1,000 live births)
- neonatal deaths are those occurring in live births up to 28 completed days after birth
- 3,024 Australian perinatal deaths
- perinatal death includes birthweight of at least 400 grams or, where birthweight is unknown, a gestational age of at least 20 weeks
- 23.5% congenital abnormalities (anomalies)
- 13.8% maternal conditions
- 12.6% unexplained antepartum death
Ten most frequently reported Birth Anomalies
- Hypospadias (More? Male movie | Genital Abnormalities - Hypospadia)
- Obstructive Defects of the Renal Pelvis (More? Renal System - Abnormalities)
- Ventricular Septal Defect (More? Cardiovascular Abnormalities - Ventricular Septal Defect)
- Congenital Dislocated Hip (More? Musculoskelal Abnormalities - Congenital Dislocation of the Hip (CDH))
- Trisomy 21 or Down syndrome - (More? Trisomy 21)
- Hydrocephalus (More? Hydrocephalus)
- Cleft Palate (More? Palate_Development)
- Trisomy 18 or Edward Syndrome - multiple abnormalities of the heart, diaphragm, lungs, kidneys, ureters and palate 86% discontinued (More? (More? Trisomy 18)
- Renal Agenesis/Dysgenesis - reduction in neonatal death and stillbirth since 1993 may be due to the more severe cases being identified in utero and being represented amongst the increased proportion of terminations (approximately 31%). (More? Renal System - Abnormalities)
- Cleft Lip and Palate - occur with another defect in 33.7% of cases.(More? Palate Development | Head Development)
(From the Victorian Perinatal Data Collection Unit in the Australian state of Victoria between 2003-2004)
2008
Congenital Anomalies in Australia 2002-2003
Congenital anomalies in Australia 2002-2003[44] is the third report in a new revised series on congenital anomalies. This report provides national information on selected congenital anomalies from 2002-2003. Presents epidemiological data on 33 selected conditions because they are monitored internationally by the International Clearinghouse of Birth Defects Surveillance and Research.
| Congenital Anomalies in Australia 2002-2003 |
|---|
Congenital anomalies in Australia 2002-2003[45] was published in 2008 as part a new revised series on 33 selected congenital anomalies also monitored internationally by the International Clearinghouse of Birth Defects Surveillance and Research.
|
| External Links Notice - The dynamic nature of the internet may mean that some of these listed links may no longer function. If the link no longer works search the web with the link text or name. Links to any external commercial sites are provided for information purposes only and should never be considered an endorsement. UNSW Embryology is provided as an educational resource with no clinical information or commercial affiliation. |
- Health initiatives by Indigenous people in Australia[46] "June Oscar is an Aboriginal woman from Marninwarntikura Women's Resource Centre, Fitzroy Crossing, in the Kimberley region of the Northern Territory, Australia, where about 4500 Aboriginal people live in more than 45 communities. She had attended 50 funerals in 1 year, many of which were for suicides related to alcohol abuse. She was also concerned about the one in four babies born with fetal alcohol spectrum disorder in the region, which she regarded as a particular disaster for an oral-based culture." (Includes a video)
- Around 143,000 alcohol and other drug treatment episodes were provided in Australia in 2008-09[47] "More episodes of this treatment were for alcohol than any other drug type, and this proportion has now risen four years in a row. ...As seen in previous years, most treatment episodes (66%) were provided to male clients."
Australian NHMRC Guidelines
NHMRC Guidelines "are intended to promote health, prevent harm, encourage best practice and reduce waste" have replaced the earlier historic 1988 NHMRC recommendations.
- Links: Clinical Practice Guidelines - Pregnancy Care (2019) | PDF | Related Documents | Australian Clinical Practice Guidelines | NHMRC guidelines
| Historic - NHMRC (1988) Recommendations | ||
|---|---|---|
Neonates be assessed for follow-up care under the following conditions:
|

Immunisation
| Australian Child Immunisation Programs 2013 | |
|---|---|
| Age | Vaccine |
| Birth |
|
| 2 months |
|
| 4 months |
|
| 6 months |
|
| 12 months |
|
| 18 months |
|
| 4 years |
|
| Notes: | Information provided for educational purposes only. Postnatal - Vaccination | Immunise Australia Program
a Hepatitis B vaccine: should be given to all infants as soon as practicable after birth. The greatest benefit is if given within 24 hours, and must be given within 7 days. b Rotavirus vaccine: third dose of vaccine is dependent on vaccine brand used. |
| Source: | Australian Immunisation Handbook 10th edition (April 2013).[48] National Immunisation Program Schedule From 1 February 2013 to 30 June 2013 PDF Immunise Australia Program. |
Historic Birth Data
- 1903 - when the crude birth rate was lower than it had ever been before, the Royal Commission On the Decline in the Birth-rate and On the Mortality of Infants in New South Wales was appointed. It reported in 1904 and concluded that '...the cause or causes of the Decline of the Birth-rate must be a force or forces over which the people themselves have control...'. In other words, couples were limiting the size of their families.
- At the turn of last century there were 117 births per 1,000 women of child bearing age (15-44 years). This approximates a total fertility rate of 3.5 babies per woman. By 1924 the total fertility rate was 3.0 and falling.
- 1934 - in the middle of the Great Depression, the total fertility rate fell to 2.1 babies per woman. It then increased during the second half of the Depression, as women who had deferred childbearing in the early years of the Depression began to have children. Fertility increased through World War II and the 1950s, and peaked in 1961 when the total fertility rate reached 3.6 babies per woman. This period of high fertility is known as the baby boom (see graph 5.28).
- 1961 - peak then total fertility rate fell rapidly, to 2.9 babies per woman by 1966. This fall can be attributed to changing social attitudes, in particular a change in people's perception of desired family size, facilitated by the contraceptive pill becoming available.
- 1970s - the total fertility rate dropped again, falling to below replacement level in 1976 where it has remained since. This fall was more marked than the fall in the early 1960s and has been linked to the increasing participation of women in the labour force, coupled with changing attitudes to family size, standard of living and lifestyle choices.
- 1996
- Women are starting childbearing later in life, and are having fewer children. In 1966, peak fertility was among 25 year old women, with 21% having babies. By 1996, peak fertility was among 29 year old women, but only 13% had babies. Primarily because fewer women are having large families, the proportion of all women having babies after they turn 40 has fallen (see graph 5.29).
- In the last 30 years, there has been a fall in the proportion of births to teenage mothers, from 11.3% of all births in 1966 to 4.9% in 1996.
- The number of babies born to mothers aged 40 years or over has also fallen, from 2.6% in 1966 to 2.1% in 1996.
Excerpt from Australia Now (ABS)
World Factbook
The World Factbook is a freely available data source that provides a "snapshot" overview of countries around the world. More accurate statistics can be found by studying data from individual countries Bureau of Statistics. The "country comparison" shows Australia's position relative to other countries around the world, the entry information in italics may have been edited from the original source.
Population
- 21,515,754 (July 2010 est.)
- country comparison to the world: 54
Population breakdown by state or territory (Australian Bureau of Statistics, June 2010 population estimates)
| Rank | State/Territory | Population | % |
|---|---|---|---|
| 1 | New South Wales | 7,238,819 | 32.4 |
| 2 | Victoria | 5,547,527 | 24.8 |
| 3 | Queensland | 4,516,361 | 20.2 |
| 4 | Western Australia | 2,296,411 | 10.3 |
| 5 | South Australia | 1,644,642 | 7.4 |
| 6 | Tasmania | 507,626 | 2.3 |
| 7 | Australian Capital Territory | 358,894 | 1.6 |
| 8 | Northern Territory | 229,675 | 1.0 |
| 9 | Australian Antarctic Territory | 1,000 | 0.0 |
| 10 | Jervis Bay Territory | 495 | 0.0 |
Age structure
- 0-14 years: 18.6% (male 2,026,975/female 1,923,828)
- 15-64 years: 67.9% (male 7,318,743/female 7,121,613)
- 65 years and over: 13.5% (male 1,306,329/female 1,565,153) (2010 est.)
- The age structure of a population affects a nation's key socioeconomic issues. Countries with young populations (high percentage under age 15) need to invest more in schools, while countries with older populations (high percentage ages 65 and over) need to invest more in the health sector.
Median age
- total: 37.5 years
- male: 36.8 years
- female: 38.3 years (2010 est.)
- This entry is the age that divides a population into two numerically equal groups; that is, half the people are younger than this age and half are older. It is a single index that summarizes the age distribution of a population. Currently, the median age ranges from a low of about 15 in Uganda and Gaza Strip to 40 or more in several European countries and Japan.
Population growth rate
- 1.171% (2010 est.)
- country comparison to the world: 107
Birth rate
- 12.39 births/1,000 population (2010 est.)
- country comparison to the world: 161
- This entry gives the average annual number of births during a year per 1,000 persons in the population at midyear; also known as crude birth rate. The birth rate is usually the dominant factor in determining the rate of population growth. It depends on both the level of fertility and the age structure of the population.
Death rate
- 6.81 deaths/1,000 population (July 2010 est.)
- country comparison to the world: 145
Net migration rate
- 6.13 migrant(s)/1,000 population (2010 est.)
- country comparison to the world: 14
Urbanization
- urban population: 89% of total population (2008)
- rate of urbanization: 1.2% annual rate of change (2005-10 est.)
Sex ratio
- at birth: 1.055 male(s)/female
- under 15 years: 1.05 male(s)/female
- 15-64 years: 1.03 male(s)/female
- 65 years and over: 0.84 male(s)/female
- total population: 1 male(s)/female (2010 est.)
- Sex ratio at birth has recently emerged as an indicator of certain kinds of sex discrimination in some countries. For instance, high sex ratios at birth in some countries are now attributed to sex-selective abortion and infanticide due to a strong preference for sons. This will affect future marriage patterns and fertility patterns.
Infant mortality rate
- total: 4.67 deaths/1,000 live births
- country comparison to the world: 192
- male: 5 deaths/1,000 live births
- female: 4.33 deaths/1,000 live births (2010 est.)
- This entry gives the number of deaths of infants under one year old in a given year per 1,000 live births in the same year; included is the total death rate, and deaths by sex, male and female. This rate is often used as an indicator of the level of health in a country.
Life expectancy at birth
- total population: 81.72 years
- country comparison to the world: 9
- male: 79.33 years
- female: 84.25 years (2010 est.)
- This entry contains the average number of years to be lived by a group of people born in the same year, if mortality at each age remains constant in the future. Life expectancy at birth is also a measure of overall quality of life in a country and summarizes the mortality at all ages.
Total fertility rate
- 1.78 children born/woman (2010 est.)
- country comparison to the world: 158
- This entry gives a figure for the average number of children that would be born per woman if all women lived to the end of their childbearing years and bore children according to a given fertility rate at each age. The total fertility rate (TFR) is a more direct measure of the level of fertility than the crude birth rate, since it refers to births per woman. This indicator shows the potential for population change in the country. A rate of two children per woman is considered the replacement rate for a population, resulting in relative stability in terms of total numbers.
HIV/AIDS
- adult prevalence rate 0.2% (2007 est.)
- country comparison to the world: 92
- people living with HIV/AIDS 18,000 (2007 est.)
- country comparison to the world: 81
- deaths fewer than 100 (2007 est.)
- country comparison to the world: 127
Ethnic groups
- white 92%, Asian 7%, aboriginal and other 1%
Religions
- Catholic 25.8%, Anglican 18.7%, Uniting Church 5.7%, Presbyterian and Reformed 3%, Eastern Orthodox 2.7%, other Christian 7.9%, Buddhist 2.1%, Muslim 1.7%, other 2.4%, unspecified 11.3%, none 18.7% (2006 Census)
Languages
- English 78.5%, Chinese 2.5%, Italian 1.6%, Greek 1.3%, Arabic 1.2%, Vietnamese 1%, other 8.2%, unspecified 5.7% (2006 Census)
Data source: The World Factbook Australia
Countries about Australian Population Size (2011)
| Rank in World | Country | Population |
| 48 | Korea, North | 24,457,492 |
| 49 | Yemen | 24,133,492 |
| 50 | Taiwan | 23,071,779 |
| 51 | Mozambique | 22,948,858 |
| 52 | Syria | 22,517,750 |
| 53 | Madagascar | 21,926,221 |
| 54 | Romania | 21,904,551 |
| 55 | Australia | 21,766,711 |
| 56 | Cote d'Ivoire | 21,504,162 |
| 57 | Sri Lanka | 21,283,913 |
| Country population comparison (1998) | ||||||
|---|---|---|---|---|---|---|
|
|
|
|
|
|
|
|
|
Population |
18,613,087 |
270,311,756 |
58,970,119 |
82,079,454 |
1,236,914,658 |
984,003,683 |
|
Age structure | ||||||
|
0-14 years: |
21% |
22% |
19% |
16% |
26% |
34% |
|
15-64 years: |
66% |
66% |
65% |
68% |
68% |
61% |
|
65 years +: |
13% |
12% |
16% |
16% |
6% |
5% |
|
Population growth rate |
0.93% |
0.87% |
0.25% |
0.02% |
0.83% |
1.71% |
|
Birth rate |
13.47 |
14.4 |
12.01 |
8.84 |
15.73 |
25.91 |
|
Death rate |
6.89 |
8.8 |
10.72 |
10.77 |
6.99 |
8.69 |
|
Sex ratio (male(s)/female) | ||||||
|
at birth: |
1.06 |
1.05 |
1.05 |
2.08 |
1.15 |
1.05 |
|
under 15 years: |
1.05 |
1.05 |
1.05 |
1.06 |
1.13 |
1.06 |
|
15-64 years: |
1.02 |
0.99 |
1.01 |
1.05 |
1.07 |
1.08 |
|
65 years +: |
0.77 |
0.7 |
0.7 |
0.59 |
0.88 |
1.04 |
|
Infant mortality rate |
5.26 |
6.44 |
5.87 |
5.2 |
45.46 |
63.14 |
|
Life expectancy at birth (years) | ||||||
|
total population: |
79.89 |
76.13 |
77.19 |
76.99 |
69.59 |
62.9 |
|
male: |
76.95 |
72.85 |
74.57 |
73.83 |
68.32 |
62.11 |
|
female: |
82.98 |
79.58 |
79.96 |
80.33 |
71.06 |
63.73 |
|
Total fertility rate (children born/woman) |
1.82 |
2.07 |
1.7 |
1.25 |
1.8 |
3.24 |
| Population Data Neighbours (1998) | ||||||
|---|---|---|---|---|---|---|
|
|
|
New Zealand |
Indonesia |
Papua |
Singapore |
Malaysia |
|
Population |
18,613,087 |
3,625,388 |
212,941,810 |
4,599,785 |
3,490,356 |
20,932,901 |
|
Age structure | ||||||
|
0-14 years: |
21% |
23% |
31% |
40% |
21% |
36% |
|
15-64 years: |
66% |
65% |
65% |
57% |
72% |
60% |
|
65 years +: |
13% |
12% |
4% |
3% |
7% |
4% |
|
Population growth rate |
0.93% |
1.04% |
1.49% |
2.27% |
1.2% |
2.11% |
|
Birth rate |
13.47 |
14.89 |
23.1 |
32.37 |
13.79 |
26.5 |
|
Death rate |
6.89 |
7.6 |
8.22 |
9.65 |
4.68 |
5.36 |
|
Sex ratio (male(s)/female) | ||||||
|
at birth: |
1.06 |
1.05 |
1.05 |
1.05 |
1.08 |
1.06 |
|
under 15 years: |
1.05 |
1.05 |
1.03 |
1.05 |
1.06 |
1.05 |
|
15-64 years: |
1.02 |
1.01 |
0.99 |
1.09 |
1 |
1 |
|
65 years +: |
0.77 |
0.76 |
0.79 |
0.84 |
0.8 |
0.77 |
|
Infant mortality rate |
5.26 |
6.37 |
59.23 |
57.09 |
3.87 |
22.45 |
|
Life expectancy at birth (years) | ||||||
|
total population: |
79.89 |
77.55 |
62.49 |
58.06 |
78.49 |
70.36 |
|
male: |
76.95 |
74.35 |
60.28 |
57.18 |
75.46 |
67.35 |
|
female: |
82.98 |
80.91 |
64.81 |
58.98 |
81.77 |
73.56 |
|
Total fertility rate (children born/woman) |
1.82 |
1.91 |
2.61 |
4.26 |
1.46 |
3.37 |
| Country population comparison (1998) | ||||||
|---|---|---|---|---|---|---|
|
|
|
|
|
|
|
|
|
Population |
18,613,087 |
270,311,756 |
58,970,119 |
82,079,454 |
1,236,914,658 |
984,003,683 |
|
Age structure | ||||||
|
0-14 years: |
21% |
22% |
19% |
16% |
26% |
34% |
|
15-64 years: |
66% |
66% |
65% |
68% |
68% |
61% |
|
65 years +: |
13% |
12% |
16% |
16% |
6% |
5% |
|
Population growth rate |
0.93% |
0.87% |
0.25% |
0.02% |
0.83% |
1.71% |
|
Birth rate |
13.47 |
14.4 |
12.01 |
8.84 |
15.73 |
25.91 |
|
Death rate |
6.89 |
8.8 |
10.72 |
10.77 |
6.99 |
8.69 |
|
Sex ratio (male(s)/female) | ||||||
|
at birth: |
1.06 |
1.05 |
1.05 |
2.08 |
1.15 |
1.05 |
|
under 15 years: |
1.05 |
1.05 |
1.05 |
1.06 |
1.13 |
1.06 |
|
15-64 years: |
1.02 |
0.99 |
1.01 |
1.05 |
1.07 |
1.08 |
|
65 years +: |
0.77 |
0.7 |
0.7 |
0.59 |
0.88 |
1.04 |
|
Infant mortality rate |
5.26 |
6.44 |
5.87 |
5.2 |
45.46 |
63.14 |
|
Life expectancy at birth (years) | ||||||
|
total population: |
79.89 |
76.13 |
77.19 |
76.99 |
69.59 |
62.9 |
|
male: |
76.95 |
72.85 |
74.57 |
73.83 |
68.32 |
62.11 |
|
female: |
82.98 |
79.58 |
79.96 |
80.33 |
71.06 |
63.73 |
|
Total fertility rate (children born/woman) |
1.82 |
2.07 |
1.7 |
1.25 |
1.8 |
3.24 |
Australian Law
The information below relates to Commonwealth Acts and Australian Law Reform Commission discussion papers.
Commonwealth Consolidated Acts
The following Australasian Government Acts relate to embryonic development and include links to the legislation provided by the Australasian Legal Information Institute (AustLII).
- Research Involving Human Embryos Act 2002 AustLII
- Prohibition of Human Cloning for Reproduction Act 2002 AustLII
- Prohibition of Human Cloning for Reproduction and the Regulation of Human Embryo Research Amendment Act 2006 AustLII | Act No. 172 of 2006
Australian Law Reform Commission
- ALRC Discussion Paper 68 Gene Patenting and Human Health AustLII
- Search Australasian Legal Information Institute: human embryo
National Health and Medical Research Council (NHMRC)
Congenital Anomalies
Australian Birth Anomalies System
The Australian Congenital Anomalies Monitoring System (ACAMS) supersedes the National Congenital Malformations and Birth Defects Data Collection (NCM&BD).
- "The national collation and reporting of birth anomalies data has been suspended in recent years due to concerns about data quality and comparability."
- Variability among states and territories in scope of birth anomalies data collections: sources of birth anomalies notifications and definitions and classifications used; method of data collection and available resources.
- Variability among the states and territories in the timing and method of the provision of birth anomalies data to the AIHW National Perinatal Statistics Unit (NPSU) for national collation and reporting.
- New Australian Birth Anomalies System should be data for birth anomalies detected up to 1 year of age.
- including data on terminations of pregnancies with birth anomalies and regardless of gestational age (i.e. including less than 20 weeks gestation).
- System will initially be based on data from the states able to detect birth anomalies at least up to 1 year of age (NSW, VIC, WA and SA), further extending the period of detection in the future.
National Perinatal Statistics Unit Publications
External Links Notice - The dynamic nature of the internet may mean that some of these listed links may no longer function. If the link no longer works search the web with the link text or name. Links to any external commercial sites are provided for information purposes only and should never be considered an endorsement. UNSW Embryology is provided as an educational resource with no clinical information or commercial affiliation.
- Neural tube defects in Australia - An epidemiological report
- Congenital Anomalies in Australia 2002-2003 (published 2008)
- Congenital Anomalies in Australia 1998-2001
- Congenital Malformations Australia 1981-1997
- Congenital Malformations Australia 1995 and 1996
- Congenital Malformations Australia 1993 and 1994
- Congenital Malformations Australia 1981-1992
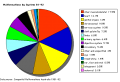
Abnormalities by system (1981-92)
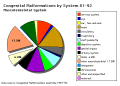
Musculoskeletal (1981-92)
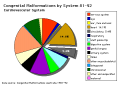
Cardiovascular (1981-92)
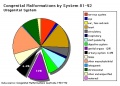
Urogenital (1981-92)


Advisory Committee on Medicines
- 1963 - Australian Drug Evaluation Committee (ADEC) was established in 1963 following the thalidomide experience.
- 2010 - the ADEC committee was replaced by the Advisory Committee on Prescription Medicines (ACPM)
- 2017 - ACPM committee was replaced by the Advisory Committee on Medicines (ACM).
- The ACM provides independent medical and scientific advice to the Minister for Health and the Therapeutic Goods Administration (TGA) on issues relating to the safety, quality and efficacy of medicines supplied in Australia including issues relating to pre-market and post-market functions for medicines.
| Australian Drug Categories |
|---|
| Legal drugs are classified, usually by each country's appropriate regulatory body, on the safety of drugs during pregnancy. In Australia, the Therapeutic Goods Authority has classes (A, B1, B2, B3, C, D and X) to define their safety. In the USA, drugs are classified by the Food and Drug Administration (FDA) into classes (A, B, C, D, and X) to define their safety. (More? Australian Drug Categories)
|
| Drug Testing |
|---|
| Typical testing of new drug compound today involves a lengthy series of animal and human studies.
Animal studies Usually tested in at least two mammalian species (rats and guinea pigs) using both single and repeated doses. For determining reproductive effects, tests on both male and female animals with dosing begins 4 weeks prior to mating are conducted to determine effects on fertility in both sexes, on embryogenesis, and on fetal malformation. Human Clinical trials Following animal studies to determine dose, efficacy and apparent safety, human studies can commence. Clinical trials are carried out under very strict conditions, set by international regulatory bodies in agreement with the principles espoused in the Declaration of Helsinki. There are four phases to the trials.
|
| After phase I to III the pharmaceutical company compiles all study data for independent assessment by government regulatory authorities in each country.
Regulatory Authorities: FDA in the USA, Therapeutic Goods Administration (TGA) in Australia, Medsafe in New Zealand, Medicines & Healthcare products Regulatory Agency (MHRA) in the UK, and Health Products and Food Branch (HPFB) in Canada. |
| Declaration of Helsinki |
| The Declaration of Helsinki was developed by The World Medical Association (WMA) as a statement of ethical principles for medical research involving human subjects, including research on identifiable human material and data. The Declaration is intended to be read as a whole and each of its constituent paragraphs should not be applied without consideration of all other relevant paragraphs. It is widely regarded as the cornerstone document on human research ethics. It is named after the location of its initial adoption in Helsinki, Finland, in June 1964. |
References
- ↑ Australian Institute of Health and Welfare 2020. Stillbirths and neonatal deaths in Australia . Cat. no. PER 107. Canberra: AIHW. Viewed 28 July 2020, https://www.aihw.gov.au/reports/mothers-babies/stillbirths-and-neonatal-deaths-in-australia
- ↑ Australian Institute of Health and Welfare 2020. Maternal deaths in Australia 2015–2017. Cat. no. PER 106. Canberra: AIHW.
- ↑ Centre for Epidemiology and Evidence. New South Wales Mothers and Babies 2018. Sydney: NSW Ministry of Health, 2019 PDF
- ↑ Australian Institute of Health and Welfare 2019. Congenital heart disease in Australia. Cat. no. CDK 14. Canberra: AIHW.
- ↑ Australian Institute of Health and Welfare 2019. Hearing health outreach services for Aboriginal and Torres Strait Islander children in the Northern Territory: July 2012 to December 2018. Cat no. [https://www.aihw.gov.au/reports/indigenous-health-welfare-services/hearing-health-outreach-services/contents/table-of-contents IHW 213]. Canberra: AIHW.
- ↑ Australian Institute of Health and Welfare 2019. Stillbirths and neonatal deaths in Australia 2015 and 2016: in brief. Perinatal statistics series no. 36. Cat. no. PER 102. Canberra: AIHW. PDF
- ↑ Australian Institute of Health and Welfare 2019. Australia’s mothers and babies 2017—in brief. Perinatal statistics series no. 35. Cat. no. PER 100. Canberra: AIHW.
- ↑ Australian Institute of Health and Welfare 2019. Incidence of insulin-treated diabetes in Australia 2017. Cat. no. CDK 11. Canberra: AIHW.
- ↑ Australian Institute of Health and Welfare 2019. Cervical screening in Australia 2019. Cancer series no. 123. Cat. no. CAN 124. Canberra: AIHW. PDF
- ↑ Australian Institute of Health and Welfare 2019. Physical activity during pregnancy 2011–12. Cat. no. PHE 243. Canberra: AIHW. PDF
- ↑ 11.0 11.1 Australian Institute of Health and Welfare 2019. Diabetes in pregnancy 2014–2015. Bulletin no. 146. Cat. no. CDK 7. Canberra: AIHW.
- ↑ Australian Institute of Health and Welfare 2018. Improving national reporting on diabetes in pregnancy: technical report. AIHW bulletin series no. 146. Cat. no. CDK 13. Canberra: AIHW.
- ↑ McHugh L, Marshall HS, Perrett KP, Nolan T, Wood N, Lambert SB, Richmond P, Ware RS, Binks P, Binks MJ & Andrews RM. (2019). The Safety of Influenza and Pertussis Vaccination in Pregnancy in a Cohort of Australian Mother-Infant Pairs, 2012-2015: The FluMum Study. Clin. Infect. Dis. , 68, 402-408. PMID: 30475988 DOI.
- ↑ Fathima P, Snelling TL, de Klerk N, Lehmann D, Blyth CC, Waddington CS & Moore HC. (2019). Perinatal Risk Factors Associated With Gastroenteritis Hospitalizations in Aboriginal and Non-Aboriginal Children in Western Australia (2000-2012): A Record Linkage Cohort Study. Pediatr. Infect. Dis. J. , 38, 169-175. PMID: 29620723 DOI.
- ↑ Ford JH, Li M, Scheil W & Roder D. (2019). Human papillomavirus infection and intrauterine growth restriction: a data-linkage study. J. Matern. Fetal. Neonatal. Med. , 32, 279-285. PMID: 28889772 DOI.
- ↑ Sampaio H, Wilcken B & Farrar M. (2018). Screening for spinal muscular atrophy. Med. J. Aust. , 209, 147-148. PMID: 30107765
- ↑ Australian Institute of Health and Welfare 2018. National Core Maternity Indicators (2004-2016). Cat no. PER 95. Canberra: AIHW.
- ↑ Australian Institute of Health and Welfare 2018. Australia’s mothers and babies 2016—in brief. Perinatal statistics series no. 34. Cat. no. PER 97. Canberra: AIHW.
- ↑ Goller JL, De Livera AM, Guy RJ, Low N, Donovan B, Law M, Kaldor JM, Fairley CK & Hocking JS. (2018). Rates of pelvic inflammatory disease and ectopic pregnancy in Australia, 2009-2014: ecological analysis of hospital data. Sex Transm Infect , , . PMID: 29720385 DOI.
- ↑ Department of Health (2018) Clinical Practice Guidelines: Pregnancy Care. Canberra: Australian Government Department of Health. (5 June 2019)
- ↑ Australian Institute of Health and Welfare 2017. Australia’s mothers and babies 2015—in brief. Perinatal statistics series no. 33. Cat no. PER 91. Canberra: AIHW.
- ↑ Australian Institute of Health and Welfare 2017. Health expenditure Australia 2015–16. Health and welfare expenditure series no. 58. Cat. no. HWE 68. Canberra: AIHW.
- ↑ AIHW 2017. Incidence of insulin-treated diabetes in Australia, 2015. Diabetes series no. 27. Cat. no. CVD 78. Canberra: AIHW. Viewed 20 February 2017 http://www.aihw.gov.au/publication-detail/?id=60129558632.
- ↑ Georges N, Guthridge SL, Li SQ, Condon JR, Barnes T & Zhao Y. (2017). Progress in closing the gap in life expectancy at birth for Aboriginal people in the Northern Territory, 1967-2012. Med. J. Aust. , 207, 25-30. PMID: 28659111
- ↑ Centre for Epidemiology and Evidence. New South Wales Mothers and Babies 2015. Sydney: NSW Ministry of Health, 2016.
- ↑ 26.0 26.1 AIHW 2016. Australia's mothers and babies 2014—in brief. Perinatal statistics series no. 32. [ http://www.aihw.gov.au/publication-detail/?id=60129557656 Cat. no. PER 87]. Canberra: AIHW.
- ↑ AIHW 2016. Australian Burden of Disease Study: impact and causes of illness and death in Australia 2011—summary report. Australian Burden of Disease Study series no. 4. Cat. no. BOD 5. Canberra: AIHW.
- ↑ AIHW 2016. National Core Maternity Indicators stage 3 and 4 results from 2010–2013. Cat. no. PER 84. Canberra: AIHW.
- ↑ AIHW 2016. Poisoning in children and young people 2012–13. Injury research and statistics series no. 97. Cat. no. INJCAT 173. Canberra: AIHW.
- ↑ AIHW 2016. Monitoring the health impacts of mandatory folic acid and iodine fortification 2016. Cat. no. PHE 208. Canberra: AIHW. PDF
- ↑ The Australian Immunisation Handbook 10th edition (2015) Canberra: Australian Government Department of Health. ISBN: 978-1-74241-861-2 Online ISBN: 978-1-74241-862-9.
- ↑ AIHW 2015. Breast cancer in young women: key facts about breast cancer in women in their 20s and 30s. Cancer series no. 96. Cat. no. CAN 94. Canberra: AIHW. http://www.aihw.gov.au/publication-detail/?id=60129553359
- ↑ AIHW 2015. Prevalence of type 1 diabetes among children aged 0–14 in Australia 2013. Diabetes series no. 24. Cat. no. CVD 70. Canberra: AIHW.
- ↑ 34.0 34.1 AIHW 2015. Health expenditure Australia 2013–14. Cat. no. HWE 63. Canberra: AIHW.
- ↑ Hilder L, Zhichao Z, Parker M, Jahan S, Chambers GM 2014. Australia’s mothers and babies 2012. Perinatal statistics series no. 30. Cat. no. PER 69. Canberra: AIHW. Viewed 16 December 2014. http://www.aihw.gov.au/publication-detail/?id=60129550033
- ↑ 36.0 36.1 AIHW 2014. Health indicators for Remote Service Delivery communities: a summary report. Cat. no. IHW 142. Canberra: AIHW. Viewed 5 November 2014 http://www.aihw.gov.au/publication-detail/?id=60129548650.
- ↑ <pubmed>25171091</pubmed>
- ↑ Johnson S, Bonello MR, Li Z, Hilder L & Sullivan EA. 2014. Maternal deaths in Australia 2006-2010. Maternal deaths series no. 4. Cat. no. PER 61. Canberra: AIHW. AIHW
- ↑ <pubmed>24908671</pubmed>
- ↑ <pubmed>24289168</pubmed>
- ↑ AIHW 2012. Australia's health 2012. Australia's health no. 13. Cat. no. AUS 156. Canberra: AIHW. Viewed February 14 2013 <http://www.aihw.gov.au/publication-detail/?id=10737422172>
- ↑ Laws P & Sullivan EA 2009. Australia's mothers and babies 2007 AIHW Perinatal statistics series no. 23 Cat. no. PER 48. Sydney: AIHW National Perinatal Statistics Unit.
- ↑ Laws P & Sullivan EA 2010 Australia's mothers and babies 2008 AIHW Perinatal statistics series no. 24 Cat. no. PER 48. Sydney: AIHW National Perinatal Statistics Unit.
- ↑ Abeywardana S & Sullivan EA 2008. Congenital anomalies in Australia 2002–2003. Birth anomalies series no. 3 Cat. no. [PER 41. Sydney: AIHW National Perinatal Statistics Unit.
- ↑ Abeywardana S & Sullivan EA 2008. Congenital anomalies in Australia 2002–2003. Birth anomalies series no. 3 Cat. no. PER 41. Sydney: AIHW National Perinatal Statistics Unit.
- ↑ <pubmed>21684368</pubmed>| Lancet
- ↑ Australian Institute of Health and Welfare 2008. Alcohol and other drug treatment services in Australia 2006–07: report on the National Minimum Data Set. Drug treatment series no. 8. Cat. no. HSE 59. Canberra: AIHW.
- ↑ Australian Immunisation Handbook 10th edition (April 2013) Immunise Australia Program
External Links
External Links Notice - The dynamic nature of the internet may mean that some of these listed links may no longer function. If the link no longer works search the web with the link text or name. Links to any external commercial sites are provided for information purposes only and should never be considered an endorsement. UNSW Embryology is provided as an educational resource with no clinical information or commercial affiliation.
- Australian Bureau of Statistics http://www.abs.gov.au | Health Statistics
- Australian Institute of Health and Welfare (AIHW) http://www.aihw.gov.au | publications
- National Perinatal Statistics Unit (NPSU) NPSU
- Perinatal Statistics Unit National Perinatal Statistics Unit | Queensland | South Australia | Teenage Pregnancies South Australia | ACT | New South Wales | Northern Territory | Western Australia | Tasmania
- AIHW 2011. National outcome measures for early childhood development: development of indicator based reporting framework. Cat. no. PHE 134. Canberra: AIHW. http://www.aihw.gov.au/publication-detail/?id=10737419493
- AIHW 2010. Australia's health 2010. Cat. no. AUS 122. Canberra: AIHW. http://www.aihw.gov.au/publication-detail/?id=6442468376
- The World Factbook Australia
Glossary Links
- Glossary: A | B | C | D | E | F | G | H | I | J | K | L | M | N | O | P | Q | R | S | T | U | V | W | X | Y | Z | Numbers | Symbols | Term Link
Cite this page: Hill, M.A. (2026, July 26) Embryology Australian Statistics. Retrieved from https://embryology.med.unsw.edu.au/embryology/index.php/Australian_Statistics
- © Dr Mark Hill 2026, UNSW Embryology ISBN: 978 0 7334 2609 4 - UNSW CRICOS Provider Code No. 00098G