Australian Statistics: Difference between revisions
mNo edit summary |
mNo edit summary |
||
| Line 948: | Line 948: | ||
* [http://www.preru.unsw.edu.au/PRERUWeb.nsf/page/NeuralTubeDefects Neural tube defects in Australia - An epidemiological report] | * [http://www.preru.unsw.edu.au/PRERUWeb.nsf/page/NeuralTubeDefects Neural tube defects in Australia - An epidemiological report] | ||
* [http://www.npesu.unsw.edu.au/surveillance/congenital-anomalies-australia-2002-2003 Congenital Anomalies in Australia 2002-2003] | * [http://www.npesu.unsw.edu.au/surveillance/congenital-anomalies-australia-2002-2003 Congenital Anomalies in Australia 2002-2003] (published 2008) | ||
* [http://www.preru.unsw.edu.au/PRERUWeb.nsf/page/ba2 Congenital Anomalies in Australia 1998-2001] | * [http://www.preru.unsw.edu.au/PRERUWeb.nsf/page/ba2 Congenital Anomalies in Australia 1998-2001] | ||
* [http://www.preru.unsw.edu.au/PRERUWeb.nsf/page/ca4 Congenital Malformations Australia 1981-1997] | * [http://www.preru.unsw.edu.au/PRERUWeb.nsf/page/ca4 Congenital Malformations Australia 1981-1997] | ||
Revision as of 13:43, 4 May 2014
| Embryology - 4 May 2024 |
|---|
| Google Translate - select your language from the list shown below (this will open a new external page) |
|
العربية | català | 中文 | 中國傳統的 | français | Deutsche | עִברִית | हिंदी | bahasa Indonesia | italiano | 日本語 | 한국어 | မြန်မာ | Pilipino | Polskie | português | ਪੰਜਾਬੀ ਦੇ | Română | русский | Español | Swahili | Svensk | ไทย | Türkçe | اردو | ייִדיש | Tiếng Việt These external translations are automated and may not be accurate. (More? About Translations) |
Introduction

This page links to the current online resources available to explore Australian population and birth data. The Australian Bureau of Statistics has detailed demographical information about the Australian population. Australia has about the same population size as Romania.
Over the last 30 years there has been a decrease in teenage women having children, with most women now have children when they are older (28-31 age), but older women (40+) are also decreasing. The births text excerpt below is an analysis of birth trends this century in Australia from Australia Now (ABS).
A separate body, Australian Institute of Health and Welfare (AIHW) National Perinatal Statistics Unit, also keeps accurate Australia-wide statistics on birth related issues including assisted reproductive technologies and major congenital malformations in Australia.
Undergraduate medical discussion of this data occurs in the BGD Tutorial - Applied Embryology and Teratology.
| Statistics Links: Introduction | Reports | World Population | World Fertility | World Infant Mortality | Maternal Mortality | Australia | Brazil | Canada | China | Germany | India | Indonesia | Europe | Myanmar | Netherlands | Spain | United Kingdom | Romania | Uganda | United States | BGD Tutorial - Applied Embryology and Teratology | National Perinatal Statistics Unit | AIHW | Category:Statistics | |
|
| Australian Population Clock - 23,360,679 |
|---|
|
23 January 2014 at 03:02:40 PM (Canberra time), the resident population of Australia is projected to be: 23,360,679
(Assumptions are consistent with figures released in Australian Demographic Statistics, December Quarter 2011 (cat. no. 3101.0). Australian Bureau of Statistics Population Clock |
2014
2012
Data from Australia's health[1]
Health
- Life expectancy has increased dramatically over the last century and continues to increase. A boy born in 2008–2010 can expect to live 79.5 years and a girl 84.0 years.
- Life expectancy at birth for Aboriginal and Torres Strait Islander people is much lower than for non-Indigenous Australians—12 years lower for boys and 10 years for girls.
Fertility
- Fertility rates differ among women of different backgrounds. Indigenous women, women from areas of low socioeconomic status, and women with lower educational qualifications have higher fertility rates than the general female population.
- Australian clinics performed more than 65,000 assisted reproductive technology (ART) treatment cycles in 2009, an increase of 15% since 2008 and almost 50% since 2005. This represents about 3% of all women who gave birth in Australia in 2009.
Mothers and babies
- The age at which women are giving birth continues to rise: in 2009 the average age of all women who gave birth was 30.0 years, compared with 29.0 in 2000. This mainly reflects an increasing proportion of older mothers (aged 35 and over) giving birth.
- Low birthweight is a key determinant of a baby’s subsequent survival and health. In 2009, the proportion of babies born with low birthweight was twice as high for women who reported smoking in pregnancy as for women who did not.
2013
December
Pregnancy And Neonatal Diabetes Outcomes in Remote Australia (PANDORA) Study[2]
- "Diabetes in pregnancy carries an increased risk of adverse pregnancy outcomes for both the mother and foetus, but it also provides an excellent early opportunity for intervention in the life course for both mother and baby. In the context of the escalating epidemic of chronic diseases among Indigenous Australians, it is vital that this risk is reduced as early as possible in the life course of the individual. The aims of the PANDORA Study are to: (i) accurately assess rates of diabetes in pregnancy in the Northern Territory (NT) of Australia, where 38% of babies are born to Indigenous mothers; (ii) assess demographic, clinical, biochemical, anthropometric, socioeconomic and early life development factors that may contribute to key maternal and neonatal birth outcomes associated with diabetes in pregnancy; and (iii) monitor relevant post-partum clinical outcomes for both the mothers and their babies."
- Links: Maternal Diabetes
March
National Core Maternity Indicators (data for 2004 through to 2009) - "Mixed trends for maternity indicators"
- higher proportion of women (80%) attending antenatal care during the first trimester.
- proportion of babies born weighing less than 2,750 grams at or after 40 weeks fell from 2.1% to 1.8% (indicates that very few exceptionally small babies are being missed during antenatal screening for poor fetal growth)
- episiotomy dropped from 16.2% to 15.1% for women giving birth without instruments.
- Rates of smoking in pregnancy in Australia also dropped-from 16.7% to 14.5%.
- induction, caesarean section and instrumental vaginal birth rates increased over the period among most groups of women.
- normal vaginal birth rates decreased proportionately.
Australian Bureau Statistics 2011

Births
- "There were 301,617 births registered in Australia in 2011, approximately 3,700 (1.2%) more than the number registered in 2010 (297,903). Just over half (51%) of all births registered in 2011 were male babies, resulting in a sex ratio at birth of 105.7 male births per 100 female births."
- "The median age of all mothers for births registered in 2011 was 30.6 years, while the median age of fathers was 33.0 years."
- "There were 17,621 births (6% of all births) registered in Australia during 2011 where at least one parent reported themselves as being an Aboriginal and/or Torres Strait Islander on the birth registration form."
Fertility
- "In 2011, Australia's total fertility rate (TFR) was 1.88 babies per woman, down very slightly from the 2010 TFR of 1.89 babies per woman. Since 1976, the total fertility rate for Australia has been below replacement level. That is, the average number of babies born to a woman throughout her reproductive life (measured by the TFR) has been insufficient to replace herself and her partner. The TFR required for replacement is currently considered to be around 2.1 babies per woman. The TFR reached a low of 1.73 babies per woman in 2001 before increasing to a thirty-year high of 1.96 babies per woman in 2008."
- "The median age of first-time mothers in 2011 was 28.9 years, 62% of whom were married at the time of giving birth."
Birth Statistics

This recent data summarised below from Australia's mothers and babies 2007[3] and 2008[4] is provided to help you as a clinician and researcher understand the current trends in reproductive medicine within Australia. Also see recent general population data in Australian Statistics.
Mothers

- 2007 289,496 women gave birth to 294,205 babies
- 2008 292,156 women gave birth to 296,925 babies
- 2007 increase of 4.3% from 2006, and 14.4% increase since 2004
- fetal death component was 2,177 and 2,188 respectively
- 29.9 years was the maternal mean age in 2007
- compared with 28.9 years in 1998 Why is this increasing age important?
- the rate of women aged 15–44 years giving birth in the population decreased slightly between 2007 and 2008.
- 41.6% of mothers had their first baby and 33.5% had their second baby
- 10,883 women were Aboriginal or Torres Strait Islander (3.8% of all women who gave birth)
- 39.5% of all mothers in the Northern Territory
- 25.2 years was the average age of these women who gave birth
- 3.1% women received ART treatment (see also below Assisted Reproduction Technology)
Babies
- 292,027 live births and 2,177 fetal deaths
- stillbirth rate of 7.4 per 1,000 births
- most births occurred in March, August and October
- 105.6 sex ratio (number of male per 100 female liveborn babies)
Gestational age
- 90.9% term (37–41 weeks gestation)
- 8.1% were preterm and 33.2 weeks was the mean gestational age for all preterm births
- Preterm births were classified groups of 20–27 weeks, 28–31 weeks and 32–36 weeks
Birthweight
- 92.1% of liveborn babies had a birthweight in the range 2,500–4,499 grams
- average birthweight was 3,374 grams
- 17,976 (6.2%) low birthweight (weighing less than 2,500 grams) (6.1% for 2008)
- 2,956 (1.0%) very low birthweight (weighing less than 1,500 grams)
- 1,288 (0.4%) extremely low birthweight (weighing less than 1,000 grams)
Apgar scores - 1.4% of liveborn babies had a low Apgar score (between 0 and 6) at 5 minutes (More? Apgar test)
Special care nurseries or neonatal intensive care units - 14.5% of liveborn babies were admitted to an SCN or NICU
Perinatal mortality

- 2,177 fetal deaths (7.4 per 1,000 births)
- fetal deaths are if the birthweight is at least 400 grams or the gestational age is 20 weeks or more
- 846 neonatal deaths (2.9 per 1,000 live births)
- neonatal deaths are those occurring in live births up to 28 completed days after birth
- 3,024 Australian perinatal deaths
- perinatal death includes birthweight of at least 400 grams or, where birthweight is unknown, a gestational age of at least 20 weeks
- 23.5% congenital abnormalities (anomalies)
- 13.8% maternal conditions
- 12.6% unexplained antepartum death
Ten most frequently reported Birth Anomalies
- Hypospadias (More? Male movie | Genital Abnormalities - Hypospadia)
- Obstructive Defects of the Renal Pelvis (More? Renal System - Abnormalities)
- Ventricular Septal Defect (More? Cardiovascular Abnormalities - Ventricular Septal Defect)
- Congenital Dislocated Hip (More? Musculoskelal Abnormalities - Congenital Dislocation of the Hip (CDH))
- Trisomy 21 or Down syndrome - (More? Trisomy 21)
- Hydrocephalus (More? Hydrocephalus)
- Cleft Palate (More? Palate_Development)
- Trisomy 18 or Edward Syndrome - multiple abnormalities of the heart, diaphragm, lungs, kidneys, ureters and palate 86% discontinued (More? (More? Trisomy 18)
- Renal Agenesis/Dysgenesis - reduction in neonatal death and stillbirth since 1993 may be due to the more severe cases being identified in utero and being represented amongst the increased proportion of terminations (approximately 31%). (More? Renal System - Abnormalities)
- Cleft Lip and Palate - occur with another defect in 33.7% of cases.(More? Palate Development | Head Development)
(From the Victorian Perinatal Data Collection Unit in the Australian state of Victoria between 2003-2004)
Immunisation
| Australian Child Immunisation Programs 2013 | |
|---|---|
| Age | Vaccine |
| Birth |
|
| 2 months |
|
| 4 months |
|
| 6 months |
|
| 12 months |
|
| 18 months |
|
| 4 years |
|
| Notes: | Information provided for educational purposes only. Postnatal - Vaccination | Immunise Australia Program
a Hepatitis B vaccine: should be given to all infants as soon as practicable after birth. The greatest benefit is if given within 24 hours, and must be given within 7 days. b Rotavirus vaccine: third dose of vaccine is dependent on vaccine brand used. |
| Source: | Australian Immunisation Handbook 10th edition (April 2013).[5] National Immunisation Program Schedule From 1 February 2013 to 30 June 2013 PDF Immunise Australia Program. |
Historic Birth Data
- 1903 - when the crude birth rate was lower than it had ever been before, the Royal Commission On the Decline in the Birth-rate and On the Mortality of Infants in New South Wales was appointed. It reported in 1904 and concluded that '...the cause or causes of the Decline of the Birth-rate must be a force or forces over which the people themselves have control...'. In other words, couples were limiting the size of their families.
- At the turn of last century there were 117 births per 1,000 women of child bearing age (15-44 years). This approximates a total fertility rate of 3.5 babies per woman. By 1924 the total fertility rate was 3.0 and falling.
- 1934 - in the middle of the Great Depression, the total fertility rate fell to 2.1 babies per woman. It then increased during the second half of the Depression, as women who had deferred childbearing in the early years of the Depression began to have children. Fertility increased through World War II and the 1950s, and peaked in 1961 when the total fertility rate reached 3.6 babies per woman. This period of high fertility is known as the baby boom (see graph 5.28).
- 1961 - peak then total fertility rate fell rapidly, to 2.9 babies per woman by 1966. This fall can be attributed to changing social attitudes, in particular a change in people's perception of desired family size, facilitated by the contraceptive pill becoming available.
- 1970s - the total fertility rate dropped again, falling to below replacement level in 1976 where it has remained since. This fall was more marked than the fall in the early 1960s and has been linked to the increasing participation of women in the labour force, coupled with changing attitudes to family size, standard of living and lifestyle choices.
- 1996
- Women are starting childbearing later in life, and are having fewer children. In 1966, peak fertility was among 25 year old women, with 21% having babies. By 1996, peak fertility was among 29 year old women, but only 13% had babies. Primarily because fewer women are having large families, the proportion of all women having babies after they turn 40 has fallen (see graph 5.29).
- In the last 30 years, there has been a fall in the proportion of births to teenage mothers, from 11.3% of all births in 1966 to 4.9% in 1996.
- The number of babies born to mothers aged 40 years or over has also fallen, from 2.6% in 1966 to 2.1% in 1996.
Excerpt from Australia Now (ABS)
World Factbook
The World Factbook is a freely available data source that provides a "snapshot" overview of countries around the world. More accurate statistics can be found by studying data from individual countries Bureau of Statistics. The "country comparison" shows Australia's position relative to other countries around the world, the entry information in italics may have been edited from the original source.
Population
- 21,515,754 (July 2010 est.)
- country comparison to the world: 54
Population breakdown by state or territory (Australian Bureau of Statistics, June 2010 population estimates)
| Rank | State/Territory | Population | % |
|---|---|---|---|
| 1 | New South Wales | 7,238,819 | 32.4 |
| 2 | Victoria | 5,547,527 | 24.8 |
| 3 | Queensland | 4,516,361 | 20.2 |
| 4 | Western Australia | 2,296,411 | 10.3 |
| 5 | South Australia | 1,644,642 | 7.4 |
| 6 | Tasmania | 507,626 | 2.3 |
| 7 | Australian Capital Territory | 358,894 | 1.6 |
| 8 | Northern Territory | 229,675 | 1.0 |
| 9 | Australian Antarctic Territory | 1,000 | 0.0 |
| 10 | Jervis Bay Territory | 495 | 0.0 |
Age structure
- 0-14 years: 18.6% (male 2,026,975/female 1,923,828)
- 15-64 years: 67.9% (male 7,318,743/female 7,121,613)
- 65 years and over: 13.5% (male 1,306,329/female 1,565,153) (2010 est.)
- The age structure of a population affects a nation's key socioeconomic issues. Countries with young populations (high percentage under age 15) need to invest more in schools, while countries with older populations (high percentage ages 65 and over) need to invest more in the health sector.
Median age
- total: 37.5 years
- male: 36.8 years
- female: 38.3 years (2010 est.)
- This entry is the age that divides a population into two numerically equal groups; that is, half the people are younger than this age and half are older. It is a single index that summarizes the age distribution of a population. Currently, the median age ranges from a low of about 15 in Uganda and Gaza Strip to 40 or more in several European countries and Japan.
Population growth rate
- 1.171% (2010 est.)
- country comparison to the world: 107
Birth rate
- 12.39 births/1,000 population (2010 est.)
- country comparison to the world: 161
- This entry gives the average annual number of births during a year per 1,000 persons in the population at midyear; also known as crude birth rate. The birth rate is usually the dominant factor in determining the rate of population growth. It depends on both the level of fertility and the age structure of the population.
Death rate
- 6.81 deaths/1,000 population (July 2010 est.)
- country comparison to the world: 145
Net migration rate
- 6.13 migrant(s)/1,000 population (2010 est.)
- country comparison to the world: 14
Urbanization
- urban population: 89% of total population (2008)
- rate of urbanization: 1.2% annual rate of change (2005-10 est.)
Sex ratio
- at birth: 1.055 male(s)/female
- under 15 years: 1.05 male(s)/female
- 15-64 years: 1.03 male(s)/female
- 65 years and over: 0.84 male(s)/female
- total population: 1 male(s)/female (2010 est.)
- Sex ratio at birth has recently emerged as an indicator of certain kinds of sex discrimination in some countries. For instance, high sex ratios at birth in some countries are now attributed to sex-selective abortion and infanticide due to a strong preference for sons. This will affect future marriage patterns and fertility patterns.
Infant mortality rate
- total: 4.67 deaths/1,000 live births
- country comparison to the world: 192
- male: 5 deaths/1,000 live births
- female: 4.33 deaths/1,000 live births (2010 est.)
- This entry gives the number of deaths of infants under one year old in a given year per 1,000 live births in the same year; included is the total death rate, and deaths by sex, male and female. This rate is often used as an indicator of the level of health in a country.
Life expectancy at birth
- total population: 81.72 years
- country comparison to the world: 9
- male: 79.33 years
- female: 84.25 years (2010 est.)
- This entry contains the average number of years to be lived by a group of people born in the same year, if mortality at each age remains constant in the future. Life expectancy at birth is also a measure of overall quality of life in a country and summarizes the mortality at all ages.
Total fertility rate
- 1.78 children born/woman (2010 est.)
- country comparison to the world: 158
- This entry gives a figure for the average number of children that would be born per woman if all women lived to the end of their childbearing years and bore children according to a given fertility rate at each age. The total fertility rate (TFR) is a more direct measure of the level of fertility than the crude birth rate, since it refers to births per woman. This indicator shows the potential for population change in the country. A rate of two children per woman is considered the replacement rate for a population, resulting in relative stability in terms of total numbers.
HIV/AIDS
- adult prevalence rate 0.2% (2007 est.)
- country comparison to the world: 92
- people living with HIV/AIDS 18,000 (2007 est.)
- country comparison to the world: 81
- deaths fewer than 100 (2007 est.)
- country comparison to the world: 127
Ethnic groups
- white 92%, Asian 7%, aboriginal and other 1%
Religions
- Catholic 25.8%, Anglican 18.7%, Uniting Church 5.7%, Presbyterian and Reformed 3%, Eastern Orthodox 2.7%, other Christian 7.9%, Buddhist 2.1%, Muslim 1.7%, other 2.4%, unspecified 11.3%, none 18.7% (2006 Census)
Languages
- English 78.5%, Chinese 2.5%, Italian 1.6%, Greek 1.3%, Arabic 1.2%, Vietnamese 1%, other 8.2%, unspecified 5.7% (2006 Census)
Data source: The World Factbook Australia
Countries about Australian Population Size (2011)
| Rank in World | Country | Population |
| 48 | Korea, North | 24,457,492 |
| 49 | Yemen | 24,133,492 |
| 50 | Taiwan | 23,071,779 |
| 51 | Mozambique | 22,948,858 |
| 52 | Syria | 22,517,750 |
| 53 | Madagascar | 21,926,221 |
| 54 | Romania | 21,904,551 |
| 55 | Australia | 21,766,711 |
| 56 | Cote d'Ivoire | 21,504,162 |
| 57 | Sri Lanka | 21,283,913 |
Historic Data - July 1998
Country Comparison (1998)
|
|
|
|
|
|
|
|
|
Population |
18,613,087 |
270,311,756 |
58,970,119 |
82,079,454 |
1,236,914,658 |
984,003,683 |
|
Age structure | ||||||
|
0-14 years: |
21% |
22% |
19% |
16% |
26% |
34% |
|
15-64 years: |
66% |
66% |
65% |
68% |
68% |
61% |
|
65 years +: |
13% |
12% |
16% |
16% |
6% |
5% |
|
Population growth rate |
0.93% |
0.87% |
0.25% |
0.02% |
0.83% |
1.71% |
|
Birth rate |
13.47 |
14.4 |
12.01 |
8.84 |
15.73 |
25.91 |
|
Death rate |
6.89 |
8.8 |
10.72 |
10.77 |
6.99 |
8.69 |
|
Sex ratio (male(s)/female) | ||||||
|
at birth: |
1.06 |
1.05 |
1.05 |
2.08 |
1.15 |
1.05 |
|
under 15 years: |
1.05 |
1.05 |
1.05 |
1.06 |
1.13 |
1.06 |
|
15-64 years: |
1.02 |
0.99 |
1.01 |
1.05 |
1.07 |
1.08 |
|
65 years +: |
0.77 |
0.7 |
0.7 |
0.59 |
0.88 |
1.04 |
|
Infant mortality rate |
5.26 |
6.44 |
5.87 |
5.2 |
45.46 |
63.14 |
|
Life expectancy at birth (years) | ||||||
|
total population: |
79.89 |
76.13 |
77.19 |
76.99 |
69.59 |
62.9 |
|
male: |
76.95 |
72.85 |
74.57 |
73.83 |
68.32 |
62.11 |
|
female: |
82.98 |
79.58 |
79.96 |
80.33 |
71.06 |
63.73 |
|
Total fertility rate (children born/woman) |
1.82 |
2.07 |
1.7 |
1.25 |
1.8 |
3.24 |
Population Data Neighbours (1998)
|
|
|
New Zealand |
Indonesia |
Papua |
Singapore |
Malaysia |
|
Population |
18,613,087 |
3,625,388 |
212,941,810 |
4,599,785 |
3,490,356 |
20,932,901 |
|
Age structure | ||||||
|
0-14 years: |
21% |
23% |
31% |
40% |
21% |
36% |
|
15-64 years: |
66% |
65% |
65% |
57% |
72% |
60% |
|
65 years +: |
13% |
12% |
4% |
3% |
7% |
4% |
|
Population growth rate |
0.93% |
1.04% |
1.49% |
2.27% |
1.2% |
2.11% |
|
Birth rate |
13.47 |
14.89 |
23.1 |
32.37 |
13.79 |
26.5 |
|
Death rate |
6.89 |
7.6 |
8.22 |
9.65 |
4.68 |
5.36 |
|
Sex ratio (male(s)/female) | ||||||
|
at birth: |
1.06 |
1.05 |
1.05 |
1.05 |
1.08 |
1.06 |
|
under 15 years: |
1.05 |
1.05 |
1.03 |
1.05 |
1.06 |
1.05 |
|
15-64 years: |
1.02 |
1.01 |
0.99 |
1.09 |
1 |
1 |
|
65 years +: |
0.77 |
0.76 |
0.79 |
0.84 |
0.8 |
0.77 |
|
Infant mortality rate |
5.26 |
6.37 |
59.23 |
57.09 |
3.87 |
22.45 |
|
Life expectancy at birth (years) | ||||||
|
total population: |
79.89 |
77.55 |
62.49 |
58.06 |
78.49 |
70.36 |
|
male: |
76.95 |
74.35 |
60.28 |
57.18 |
75.46 |
67.35 |
|
female: |
82.98 |
80.91 |
64.81 |
58.98 |
81.77 |
73.56 |
|
Total fertility rate (children born/woman) |
1.82 |
1.91 |
2.61 |
4.26 |
1.46 |
3.37 |
Australian Law
The information below relates to Commonwealth Acts and Australian Law Reform Commission discussion papers.
Commonwealth Consolidated Acts
The following Australasian Government Acts relate to embryonic development and include links to the legislation provided by the Australasian Legal Information Institute (AustLII).
- Research Involving Human Embryos Act 2002 AustLII
- Prohibition of Human Cloning for Reproduction Act 2002 AustLII
- Prohibition of Human Cloning for Reproduction and the Regulation of Human Embryo Research Amendment Act 2006 AustLII
Australian Law Reform Commission
- ALRC Discussion Paper 68 Gene Patenting and Human Health AustLII
- Search Australasian Legal Information Institute: human embryo
Congenital Anomalies
Australian Birth Anomalies System
The Australian Congenital Anomalies Monitoring System (ACAMS) supersedes the National Congenital Malformations and Birth Defects Data Collection (NCM&BD).
- "The national collation and reporting of birth anomalies data has been suspended in recent years due to concerns about data quality and comparability."
- Variability among states and territories in scope of birth anomalies data collections: sources of birth anomalies notifications and definitions and classifications used; method of data collection and available resources.
- Variability among the states and territories in the timing and method of the provision of birth anomalies data to the AIHW National Perinatal Statistics Unit (NPSU) for national collation and reporting.
- New Australian Birth Anomalies System should be data for birth anomalies detected up to 1 year of age.
- including data on terminations of pregnancies with birth anomalies and regardless of gestational age (i.e. including less than 20 weeks gestation).
- System will initially be based on data from the states able to detect birth anomalies at least up to 1 year of age (NSW, VIC, WA and SA), further extending the period of detection in the future.
National Perinatal Statistics Unit Publications
External Links Notice - The dynamic nature of the internet may mean that some of these listed links may no longer function. If the link no longer works search the web with the link text or name. Links to any external commercial sites are provided for information purposes only and should never be considered an endorsement. UNSW Embryology is provided as an educational resource with no clinical information or commercial affiliation.
- Neural tube defects in Australia - An epidemiological report
- Congenital Anomalies in Australia 2002-2003 (published 2008)
- Congenital Anomalies in Australia 1998-2001
- Congenital Malformations Australia 1981-1997
- Congenital Malformations Australia 1995 and 1996
- Congenital Malformations Australia 1993 and 1994
- Congenital Malformations Australia 1981-1992
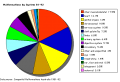
Abnormalities by system (1981-92)
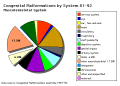
Musculoskeletal (1981-92)
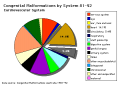
Cardiovascular (1981-92)


References
- ↑ AIHW 2012. Australia's health 2012. Australia's health no. 13. Cat. no. AUS 156. Canberra: AIHW. Viewed February 14 2013 <http://www.aihw.gov.au/publication-detail/?id=10737422172>
- ↑ <pubmed>24289168</pubmed>
- ↑ Laws P & Sullivan EA 2009. Australia's mothers and babies 2007 AIHW Perinatal statistics series no. 23 Cat. no. PER 48. Sydney: AIHW National Perinatal Statistics Unit.
- ↑ Laws P & Sullivan EA 2010 Australia's mothers and babies 2008 AIHW Perinatal statistics series no. 24 Cat. no. PER 48. Sydney: AIHW National Perinatal Statistics Unit.
- ↑ Australian Immunisation Handbook 10th edition (April 2013) Immunise Australia Program
External Links
External Links Notice - The dynamic nature of the internet may mean that some of these listed links may no longer function. If the link no longer works search the web with the link text or name. Links to any external commercial sites are provided for information purposes only and should never be considered an endorsement. UNSW Embryology is provided as an educational resource with no clinical information or commercial affiliation.
- Australian Bureau of Statistics http://www.abs.gov.au | Health Statistics
- Australian Institute of Health and Welfare (AIHW) http://www.aihw.gov.au | publications
- National Perinatal Statistics Unit (NPSU) NPSU
- Perinatal Statistics Unit National Perinatal Statistics Unit | Queensland | South Australia | Teenage Pregnancies South Australia | ACT | New South Wales | Northern Territory | Western Australia | Tasmania
- AIHW 2011. National outcome measures for early childhood development: development of indicator based reporting framework. Cat. no. PHE 134. Canberra: AIHW. http://www.aihw.gov.au/publication-detail/?id=10737419493
- AIHW 2010. Australia's health 2010. Cat. no. AUS 122. Canberra: AIHW. http://www.aihw.gov.au/publication-detail/?id=6442468376
- The World Factbook Australia
Glossary Links
- Glossary: A | B | C | D | E | F | G | H | I | J | K | L | M | N | O | P | Q | R | S | T | U | V | W | X | Y | Z | Numbers | Symbols | Term Link
Cite this page: Hill, M.A. (2024, May 4) Embryology Australian Statistics. Retrieved from https://embryology.med.unsw.edu.au/embryology/index.php/Australian_Statistics
- © Dr Mark Hill 2024, UNSW Embryology ISBN: 978 0 7334 2609 4 - UNSW CRICOS Provider Code No. 00098G