United Kingdom Statistics
Introduction
This page links to the current online resources available to explore United Kingdom population and birth data. The UK National Statistics has detailed demographical information about the UK population.
| Statistics Links: Introduction | Reports | World Population | World Fertility | World Infant Mortality | Maternal Mortality | Australia | Brazil | Canada | China | Germany | India | Indonesia | Europe | Myanmar | Netherlands | Spain | United Kingdom | Romania | Uganda | United States | BGD Tutorial - Applied Embryology and Teratology | National Perinatal Statistics Unit | AIHW | Category:Statistics | |
|
Prevalence of congenital anomalies in five British regions, 1991-99
Arch Dis Child Fetal Neonatal Ed. 2005 Sep;90(5):F374-9.
Rankin J, Pattenden S, Abramsky L, Boyd P, Jordan H, Stone D, Vrijheid M, Wellesley D, Dolk H. Source School of Population and Health Sciences, Epidemiology and Public Health, University of Newcastle, UK. j.m.rankin@ncl.ac.uk Abstract AIMS: To describe trends in total and live birth prevalence, regional differences in prevalence, and outcome of pregnancy of selected congenital anomalies.
METHODS: Population based registry study of 839,521 births to mothers resident in five geographical areas of Britain during 1991-99. Main outcome measures were: total and live birth prevalence; pregnancy outcome; proportion of stillbirths due to congenital anomalies; and secular trends.
RESULTS: The sample consisted of 10,844 congenital anomalies, giving a total prevalence of 129 per 10,000 registered births (95% CI 127 to 132). Live birth prevalence was 82.2 per 10,000 births (95% CI 80.3 to 84.2) and declined significantly with time. The proportion of all stillbirths with a congenital anomaly was 10.5% (453 stillbirths). The proportion of pregnancies resulting in a termination increased from 27% (289 cases) in 1991 to 34.7% (384 cases) in 1999, whereas the proportion of live births declined from 68.2% (730 cases) to 58.5% (648 cases). Although similar rates of congenital anomaly groups were notified to the registers, variation in rates by register was present. There was a secular decline in the total prevalence of non-chromosomal and an increase in chromosomal anomalies.
CONCLUSIONS: Regional variation exists in the prevalence of specific congenital anomalies. For some anomalies this can be partially explained by ascertainment variation. For others (neural tube defects, diaphragmatic hernia, gastroschisis), higher prevalence rates in the northern regions (Glasgow and Northern) were true differences. Live birth prevalence declined over the study due to an increase in terminations of pregnancy.
PMID: 16113153 http://www.ncbi.nlm.nih.gov/pubmed/16113153
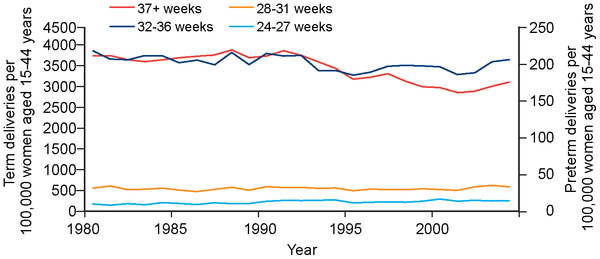
Scotland - spontaneous births 1980-2004
General Statistics

Population: 62,698,362 (July 2011 est.) country comparison to the world: 22
Age structure
- 0-14 years: 17.3% (male 5,575,119/female 5,301,301)
- 15-64 years: 66.2% (male 20,979,401/female 20,500,913)
- 65 years and over: 16.5% (male 4,564,375/female 5,777,253) (2011 est.)
Median age:
- total: 40 years
- male: 38.8 years
- female: 41.1 years (2011 est.)
Population growth rate
- 0.557% (2011 est.) country comparison to the world: 148
Birth rate: 12.29 births/1,000 population (2011 est.) country comparison to the world: 162
Death rate: 9.33 deaths/1,000 population (July 2011 est.) country comparison to the world: 64
Net migration rate: 2.6 migrant(s)/1,000 population (2011 est.) country comparison to the world: 32
Sex ratio
- at birth: 1.052 male(s)/female
- under 15 years: 1.05 male(s)/female
- 15-64 years: 1.03 male(s)/female
- 65 years and over: 0.76 male(s)/female
- total population: 0.98 male(s)/female (2011 est.)
Infant mortality rate
- total: 4.62 deaths/1,000 live births country comparison to the world: 189
- male: 5.07 deaths/1,000 live births
- female: 4.15 deaths/1,000 live births (2011 est.)
Life expectancy at birth
- total population: 80.05 years country comparison to the world: 28
- male: 77.95 years
- female: 82.25 years (2011 est.)
Total fertility rate
- 1.91 children born/woman (2011 est.) country comparison to the world: 139
HIV/AIDS
- HIV/AIDS - adult prevalence rate: 0.2% (2009 est.) country comparison to the world: 107
- HIV/AIDS - people living with HIV/AIDS:,85,000 (2009 est. country comparison to the world: 45
- HIV/AIDS - deaths: fewer than 1,000 (2009 est.) country comparison to the world: 80
Ethnic groups
- Ethnic groups: white (of which English 83.6%, Scottish 8.6%, Welsh 4.9%, Northern Irish 2.9%) 92.1%, black 2%, Indian 1.8%, Pakistani 1.3%, mixed 1.2%, other 1.6% (2001 census)
Data: The World Factbook United Kingdom
External Links
External Links Notice - The dynamic nature of the internet may mean that some of these listed links may no longer function. If the link no longer works search the web with the link text or name. Links to any external commercial sites are provided for information purposes only and should never be considered an endorsement. UNSW Embryology is provided as an educational resource with no clinical information or commercial affiliation.
- UK National Statistics
- The World Factbook United Kingdom
- Australian Bureau of Statistics http://www.abs.gov.au | Health Statistics
- Australian Institute of Health and Welfare (AIHW) http://www.aihw.gov.au | publications
Glossary Links
- Glossary: A | B | C | D | E | F | G | H | I | J | K | L | M | N | O | P | Q | R | S | T | U | V | W | X | Y | Z | Numbers | Symbols | Term Link
Cite this page: Hill, M.A. (2024, May 3) Embryology United Kingdom Statistics. Retrieved from https://embryology.med.unsw.edu.au/embryology/index.php/United_Kingdom_Statistics
- © Dr Mark Hill 2024, UNSW Embryology ISBN: 978 0 7334 2609 4 - UNSW CRICOS Provider Code No. 00098G
- ↑ <pubmed>20543995</pubmed>| PLoS Medicine

