File:Mouse limb tissue development.jpg: Difference between revisions
No edit summary |
No edit summary |
||
| Line 9: | Line 9: | ||
:'''Links:''' [[:File:Mouse limb skeleton cartoon.jpg|Image - Mouse limb skeleton cartoon]] | [[:File:Mouse limb tissue development.jpg|Image - Mouse limb tissue development]] | [[Musculoskeletal_System_-_Limb_Development|Limb Development]] | [[Mouse Development]] | :'''Links:''' [[:File:Mouse limb skeleton cartoon.jpg|Image - Mouse limb skeleton cartoon]] | [[:File:Mouse limb tissue development.jpg|Image - Mouse limb tissue development]] | [[Musculoskeletal_System_-_Limb_Development|Limb Development]] | [[Mouse Development]] | ||
{{CarnegieComparisonHRM}} | |||
Cartoon has been cropped and relabelled from Figure 5 and legend edited. | Cartoon has been cropped and relabelled from Figure 5 and legend edited. | ||
Revision as of 14:27, 4 January 2012
Mouse Limb Tissue Development
Change in cell types and tissue formation as a function of mouse developmental stage.
- Highlighted are key events during bone, muscle, nerve and skin formation.
- Some key molecules in these processes are shown.
- Cell type morphologies for different stages of skeletal development.
- Links: Image - Mouse limb skeleton cartoon | Image - Mouse limb tissue development | Limb Development | Mouse Development
| Carnegie | Stage | |||||||||||||||||||||||
| Human | Days | 1 | 2-3 | 4-5 | 5-6 | 7-12 | 13-15 | 15-17 | 17-19 | 20 | 22 | 24 | 28 | 30 | 33 | 36 | 40 | 42 | 44 | 48 | 52 | 54 | 55 | 58 |
| Mouse | Days | 1 | 2 | 3 | E4.5 | E5.0 | E6.0 | E7.0 | E8.0 | E9.0 | E9.5 | E10 | E10.5 | E11 | E11.5 | E12 | E12.5 | E13 | E13.5 | E14 | E14.5 | E15 | E15.5 | E16 |
| Rat | Days | 1 | 3.5 | 4-5 | 5 | 6 | 7.5 | 8.5 | 9 | 10.5 | 11 | 11.5 | 12 | 12.5 | 13 | 13.5 | 14 | 14.5 | 15 | 15.5 | 16 | 16.5 | 17 | 17.5 |
| Note these Carnegie stages are only approximate day timings for average of embryos. Links: Carnegie Stage Comparison | ||||||||||||||||||||||||
| ||||||||||||||||||||||||
Cartoon has been cropped and relabelled from Figure 5 and legend edited.
Reference
<pubmed>22174793</pubmed>
This is an open-access article, free of all copyright, and may be freely reproduced, distributed, transmitted, modified, built upon, or otherwise used by anyone for any lawful purpose. The work is made available under the Creative Commons CC0 public domain dedication.
Figure 5. Journal.pone.0028358.g005.jpg
File history
Click on a date/time to view the file as it appeared at that time.
| Date/Time | Thumbnail | Dimensions | User | Comment | |
|---|---|---|---|---|---|
| current | 13:00, 13 February 2013 | 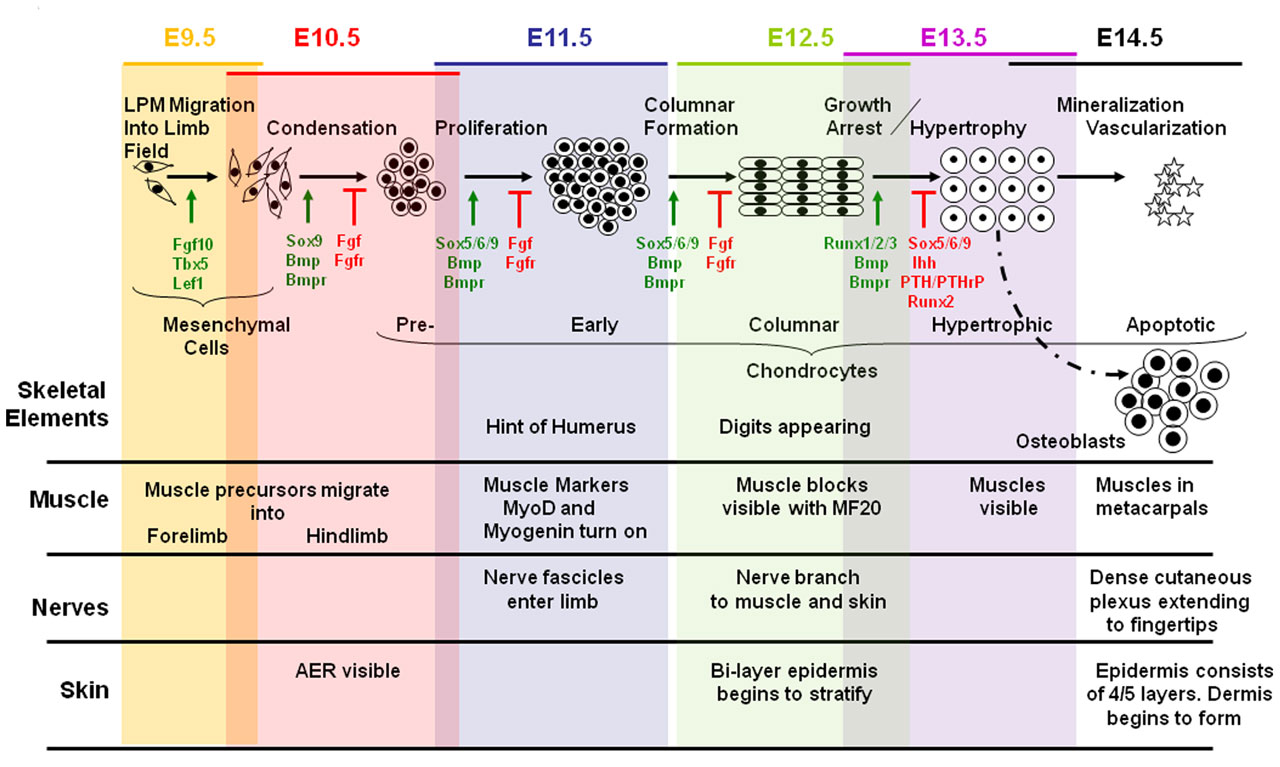 | 1,280 × 767 (161 KB) | Z8600021 (talk | contribs) | change width to 1280 pixels |
| 12:49, 4 January 2012 | 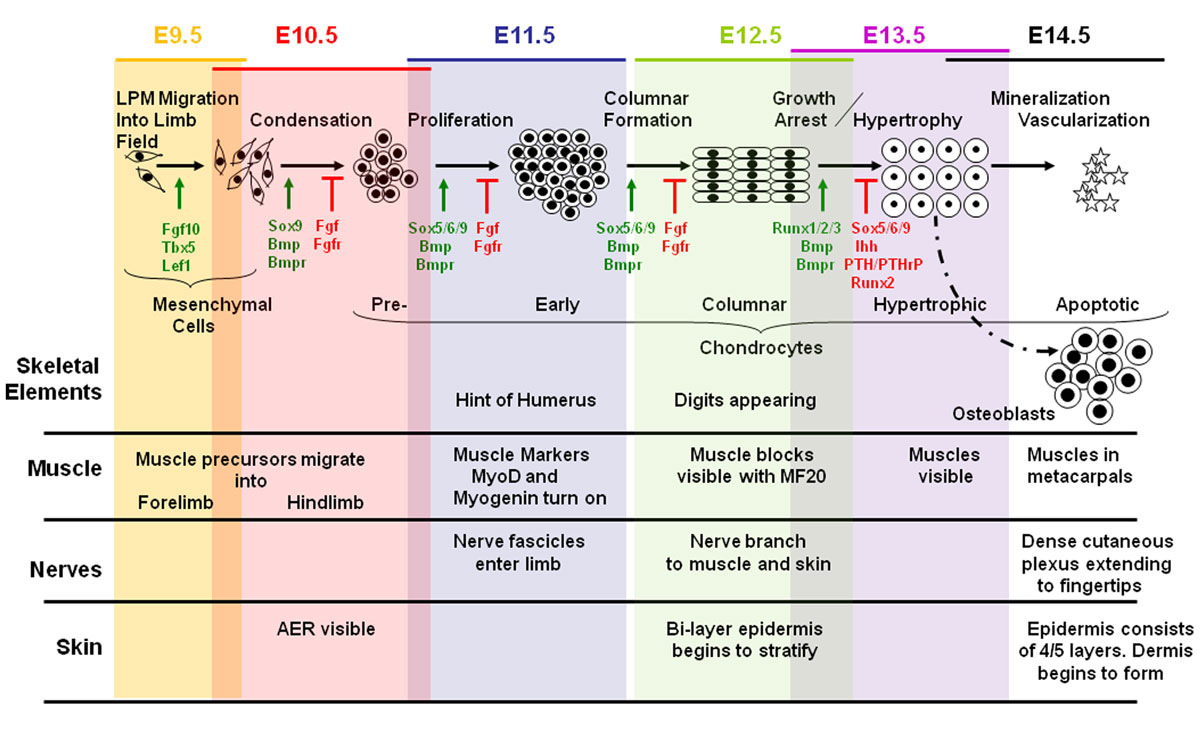 | 1,200 × 743 (164 KB) | S8600021 (talk | contribs) | ==Mouse Limb Tissue Development== Graphical depiction of the change in cell types and tissue formation as a function of developmental stage, highlighting key events during bone, muscle, nerve and skin formation. Some key molecules known to participate i |
You cannot overwrite this file.
File usage
The following 11 pages use this file:
- 2014 Group Project 8
- BGDA Practical 7 - Week 6
- K12 Comparative Embryology
- Lecture - Limb Development
- Lecture - Musculoskeletal Development
- Mouse Development
- Musculoskeletal System - Appendicular Skeleton Development
- Musculoskeletal System - Limb Development
- Musculoskeletal System - Muscle Development
- Musculoskeletal System - Muscle Development Timeline
- Talk:2014 Group Project 8