Category:Statistics: Difference between revisions
From Embryology
mNo edit summary |
mNo edit summary |
||
| Line 1: | Line 1: | ||
This {{Embryology}} category shows content related to all statistical information about development. Note that this includes several reports. | This {{Embryology}} category shows content related to all [[Embryology Statistics|statistical information]] about development. Note that this includes several reports. | ||
Main Page - [[Embryology Statistics|'''Embryology Statistics''']] | Main Page - [[Embryology Statistics|'''Embryology Statistics''']] | ||
<br> | |||
<br> | |||
{{Statistics Links}} | |||
<br> | |||
Latest revision as of 04:47, 26 May 2018
This Embryology category shows content related to all statistical information about development. Note that this includes several reports.
Main Page - Embryology Statistics
| Statistics Links: Introduction | Reports | World Population | World Fertility | World Infant Mortality | Maternal Mortality | Australia | Brazil | Canada | China | Germany | India | Indonesia | Europe | Myanmar | Netherlands | Spain | United Kingdom | Romania | Uganda | United States | BGD Tutorial - Applied Embryology and Teratology | National Perinatal Statistics Unit | AIHW | Category:Statistics | |
|
Subcategories
This category has the following 9 subcategories, out of 9 total.
Pages in category 'Statistics'
The following 67 pages are in this category, out of 67 total.
A
- Abnormal Development - Australian Statistics
- Abnormal Development - Developmental Origins of Health and Disease
- Abnormal Development - Folic Acid and Neural Tube Defects
- Template:Australian GIT abnormalities 2002-2003
- Template:Australian Palate abnormalities 2002-2003
- Template:Australian Population Clock
- Australian Statistics
- Template:Australian statistics
- Australia’s mothers and babies 2007
- Australia’s mothers and babies 2008
- Australia’s mothers and babies 2009
- Australia’s mothers and babies 2010
- Australia’s mothers and babies 2011
- Australia’s mothers and babies 2012
- Australia’s mothers and babies 2013
- Australia’s mothers and babies 2014
- Australia’s mothers and babies 2015
- Australia’s mothers and babies 2016
C
S
U
Media in category 'Statistics'
The following 141 files are in this category, out of 141 total.
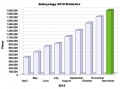
 2010 Wiki Stats.xls ; 9 KB
- 2012 Wiki Stats.xls ; 22 KB
- 2013 Wiki Stats.xls ; 28 KB
- 2014 Wiki Stats.xls ; 29 KB
- 2015 Wiki Stats.xls ; 29 KB
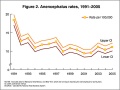
 Abnormal AusData81-92.png 523 × 358; 10 KB
 Abnormal AusData81-92Graph.png 509 × 320; 7 KB
 Abnormal81-92-heart.png 481 × 344; 6 KB
 Abnormal81-92-neuron.png 481 × 344; 9 KB
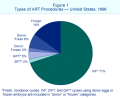 ART types USA 1996.png 417 × 341; 25 KB
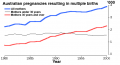 Aus multiple birth graph.png 541 × 292; 5 KB
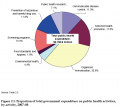 Aus public health activities 2007-08.png 669 × 598; 52 KB
 Australia and world population growth graph.jpg 1,000 × 566; 97 KB
 Australia mothers and babies 2009.jpg 148 × 210; 7 KB
 Australia mothers and babies 2010.jpg 424 × 600; 39 KB
 Australia mothers and babies 2011.jpg 421 × 600; 38 KB
 Australia mothers and babies 2012.jpg 424 × 600; 39 KB
 Australia mothers and babies 2013.jpg 422 × 600; 46 KB
 Australia's mothers and babies 2014.jpg 505 × 709; 61 KB
 Australia's mothers and babies 2015.jpg 496 × 709; 27 KB
 Australia's mothers and babies 2016.jpg 557 × 800; 37 KB
 Australian abnormalities 81-92 git.jpg 481 × 344; 43 KB
 Australian abnormalities 81-92 urogenital.jpg 600 × 429; 54 KB
 Australian abnormalities graph allsystem.png 509 × 320; 7 KB
 Australian abnormalities pie skmus.png 481 × 344; 9 KB
 Australian abnormalities pie urogen.png 481 × 344; 6 KB
 Australian caesarean and instrumental birth 2009.jpg 800 × 460; 48 KB
 Australian health-care structure and funding.jpg 1,200 × 808; 145 KB
 Australian nursing and midwifery labour force 2008.jpg 800 × 657; 110 KB
 Australian-births 2007.png 500 × 500; 7 KB
 Australian-births 2011.jpg 800 × 648; 35 KB
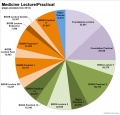
 BGD Lectures 2010- page view graph01.jpg 755 × 556; 32 KB
 BGD Practical 12 2010- page view graph01.jpg 908 × 540; 44 KB
 BGD Practical 3 2010- page view graph01.jpg 800 × 547; 50 KB
 BGD Practical 6 2010- page view graph01.jpg 925 × 501; 45 KB
 Brain growth and birth size.jpg 800 × 492; 70 KB
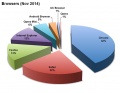 Browser nov14.jpg 559 × 431; 30 KB
- Cardiac Tutorial statistics.xls ; 33 KB
 Causes of neonatal death globally 2000.jpg 600 × 427; 135 KB
 CDC Congenital abnormality graph.jpg 800 × 498; 73 KB
 CDC-XX length birth to 3 years.png 684 × 927; 75 KB
 CDC-XY length birth to 3 years.png 691 × 933; 77 KB
 Demographics of Romania 2013.pdf ; 303 KB
 Ectopic Pregnancies- United-States 1970-1992.jpg 800 × 543; 60 KB
 Ectopic Pregnancies- United-States 1997-2006.jpg 800 × 332; 19 KB
 Fetal length and weight change.jpg 600 × 444; 47 KB
 Fetal length change.jpg 972 × 648; 72 KB
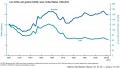
 File-Scotland - spontaneous births 1980-2004.jpg 600 × 259; 32 KB
 Foundations2010- page view graph01.jpg 680 × 461; 24 KB
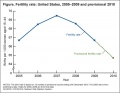
 Germany fertility rate graph.jpg 600 × 519; 37 KB
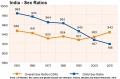 India sex ratio graph.jpg 800 × 528; 63 KB
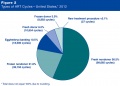
 IVF cycles ANZ 1999-2004.jpg 585 × 372; 33 KB
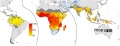 Malaria global limits 2007.jpg 1,000 × 387; 80 KB
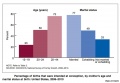
 Mean maternal age term or preterm birth.jpg 600 × 393; 22 KB
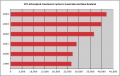
 Medicine2012accesses.jpg 734 × 705; 68 KB
 Netherlands map.jpg 328 × 353; 41 KB
 Neural tube defects sex ratio graph 01.png 2,220 × 740; 406 KB
 Non-syndrome abnormalities USA 1998-2008 graph.jpg 770 × 502; 40 KB
 Normal distribution curve.jpg 720 × 460; 52 KB
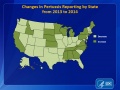
 NSW-pertussis-notification-graph 2012-16.jpg 700 × 658; 71 KB
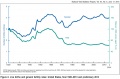
 Perinatal mortality rate NSW 1992-2002.png 800 × 600; 6 KB
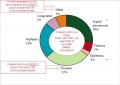
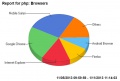 Php-most used browsers May-Oct 2013.jpg 593 × 400; 24 KB
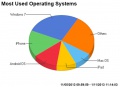 Php-most used operating systems May-Oct 2013.jpg 550 × 400; 25 KB
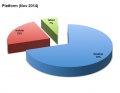 Platform nov14.jpg 559 × 431; 20 KB
 Preterm fetal-infant growth chart.jpg 1,000 × 1,361; 267 KB
 Rubella and measles elimination in the Americas.jpg 995 × 790; 160 KB
 SCN-NCIU-AUS2015 graph.jpg 1,000 × 708; 57 KB
 Search embryology 2014-04-02.jpg 1,000 × 557; 132 KB
 Spontaneous births.jpg 1,000 × 431; 63 KB
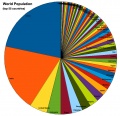
 Statistics world population 2010.jpg 800 × 616; 39 KB
 Statistics-Utah heart defects.jpg 580 × 350; 35 KB
 Syndrome abnormalities USA 1998-2008 graph.jpg 572 × 513; 36 KB
 Teen pregnancy USA.png 532 × 339; 7 KB
- UK Growth Chart-A4 Boys NICM.pdf ; 138 KB
- UK Growth Chart-A4 Girls NICM.pdf ; 138 KB
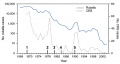
 USA anencephaly rates.jpg 600 × 450; 45 KB
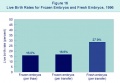 USA ART live birth rates 1996.jpg 466 × 324; 22 KB
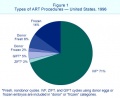 USA assisted reproductive technology 1996.jpg 417 × 341; 25 KB
 USA Births 1920-2013 preliminary 2014.jpg 1,179 × 776; 143 KB
 USA Births 1920-2013.jpg 1,200 × 681; 94 KB
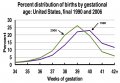 USA births by gestational age 1990-2006 graph.png 2,574 × 1,774; 417 KB
 USA births fertility 2010.jpg 800 × 617; 54 KB
 USA Cesarean Births 2013.jpg 1,000 × 598; 64 KB
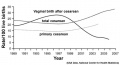 USA data - Vaginal birth after cesarean.jpg 627 × 338; 29 KB
 USA intended births graph.jpg 800 × 556; 56 KB
 USA map West Nile virus september 2012.jpg 600 × 392; 48 KB
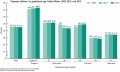
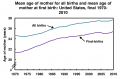 USA mean age of mother 1970- 2010 graph.png 2,622 × 1,732; 324 KB
 USA rubella and congenital rubella syndrome cases.jpg 800 × 427; 44 KB
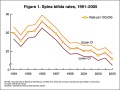 USA spina bifida rates.jpg 600 × 450; 46 KB
 USA unintended births graph.jpg 891 × 633; 103 KB
 USA-ART-2009-cover.jpg 463 × 600; 66 KB
 USA-ART-2009-donor-vs-own-eggs.jpg 859 × 605; 84 KB
 USA-ART-2012-cover.jpg 612 × 792; 89 KB
 USA-ART-2013-cover.jpg 612 × 792; 92 KB
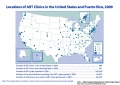 USA-ART2009-clinics.jpg 859 × 605; 127 KB
 USA-ART2009-donor-fresh-outcomes.jpg 859 × 605; 107 KB
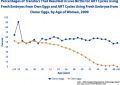
 USA-ART2009-donor-maternal-age.jpg 859 × 605; 52 KB
 USA-ART2009-nondonor-embryos-transferred.jpg 859 × 605; 66 KB
 USA-ART2009-nondonor-frozen-fresh-outcomes.jpg 859 × 605; 93 KB
 USA-ART2009-nondonor-low-birthweight.jpg 859 × 605; 72 KB
 USA-ART2009-nondonor-maternal-age.jpg 859 × 605; 57 KB
 USA-ART2009-nondonor-miscarriage.jpg 859 × 605; 61 KB
 USA-ART2009-nondonor-outcomes 1.jpg 859 × 605; 60 KB
 USA-ART2009-nondonor-outcomes-2.jpg 859 × 605; 86 KB
 USA-ART2009-nondonor-outcomes-3.jpg 859 × 605; 102 KB
 USA-ART2009-nondonor-outcomes-4.jpg 859 × 605; 89 KB
 USA-ART2009-nondonor-outcomes-5.jpg 859 × 605; 116 KB
 USA-ART2009-nondonor-preterm.jpg 859 × 605; 70 KB
 USA-ART2009-nondonor-procedure.jpg 859 × 605; 59 KB
 USA-ART2009-nondonor-results.jpg 859 × 605; 73 KB
 USA-ART2009-outcomes-1.jpg 859 × 605; 72 KB
 USA-ART2009-types-of-ART.jpg 859 × 605; 63 KB
 USA-ART2012-maternal-age.jpg 1,000 × 819; 88 KB
 USA-ART2012-outcomes-1.jpg 800 × 716; 84 KB
 USA-ART2012-types-of-ART-maternal-age.jpg 800 × 752; 96 KB
 USA-ART2012-types-of-ART.jpg 952 × 682; 82 KB
 USA-births 1925-2009.jpg 600 × 343; 20 KB
 USA-pertussis-notification-graph 2014.jpg 850 × 638; 81 KB
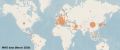 WHO coronavirus world data 1.jpg 800 × 334; 55 KB
 WHO IPCS regions.jpg 600 × 435; 48 KB
 WHO map maternal mortality ratio 2015.jpg 1,200 × 786; 166 KB
 WHO Report 2007 - Global tuberculosis new cases 2007.jpg 600 × 379; 26 KB
 WHO-XX length birth to 2 years.png 1,136 × 805; 57 KB
 WHO-XY length birth to 2 years.png 1,136 × 803; 57 KB
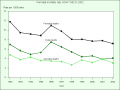
 Wikiviewstats.jpg 726 × 541; 41 KB
 Wikiviewstats2011.jpg 660 × 522; 59 KB
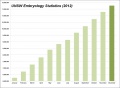 Wikiviewstats2012.jpg 800 × 584; 45 KB
 Wikiviewstats2013.jpg 800 × 584; 54 KB
 World fertility graph01.jpg 946 × 957; 154 KB
 World infant mortality 01.jpg 1,068 × 979; 147 KB
 World map iodine status 2007.jpg 1,191 × 826; 185 KB
 World neonatal death.jpg 1,024 × 512; 72 KB
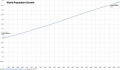
 World population graph01.jpg 807 × 782; 173 KB
 World population graph02.jpg 722 × 655; 70 KB
 World population graph03.jpg 1,000 × 581; 37 KB


