Reports
| Embryology - 27 Apr 2024 |
|---|
| Google Translate - select your language from the list shown below (this will open a new external page) |
|
العربية | català | 中文 | 中國傳統的 | français | Deutsche | עִברִית | हिंदी | bahasa Indonesia | italiano | 日本語 | 한국어 | မြန်မာ | Pilipino | Polskie | português | ਪੰਜਾਬੀ ਦੇ | Română | русский | Español | Swahili | Svensk | ไทย | Türkçe | اردو | ייִדיש | Tiếng Việt These external translations are automated and may not be accurate. (More? About Translations) |
Introduction
A start page for exploring reports that relate to embryological development. Many of these contain statistical analysis of country by country or world data by various government and non-government bodies. I have also included on this page legislation that relates to embryonic development.
- Reports - Give a spoken or written account of something that one has observed, heard, done, or investigated.
| Statistics Links: Introduction | Reports | World Population | World Fertility | World Infant Mortality | Maternal Mortality | Australia | Brazil | Canada | China | Germany | India | Indonesia | Europe | Myanmar | Netherlands | Spain | United Kingdom | Romania | Uganda | United States | BGD Tutorial - Applied Embryology and Teratology | National Perinatal Statistics Unit | AIHW | Category:Statistics | |
|
Some Recent Findings
|
World Health Organization (WHO)
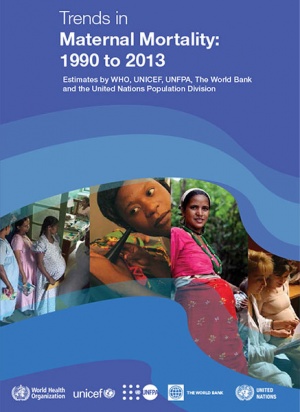
Trends in Maternal Mortality 1990 to 2013
- An estimated 289 000 women died in 2013 due to complications in pregnancy and childbirth, down from 523 000 in 1990.
- more than 1 in 4 maternal deaths are caused by pre-existing medical conditions such as diabetes, HIV, malaria and obesity, whose health impacts can all be aggravated by pregnancy.
- A related WHO study of causes of more than 60 000 maternal deaths in 115 countries caused 28% of the deaths.
- similar to the proportion of deaths during pregnancy and childbirth from severe bleeding.
- severe bleeding (mostly during and after childbirth) 27%
- pregnancy-induced high blood pressure 14%
- infections 11%
- obstructed labour and other direct causes 9%
- abortion complications 8%
- blood clots (embolism) 3%.
Ten countries account for about 60% of global maternal deaths:
- India (50 000)
- Nigeria (40 000)
- Democratic Republic of the Congo (21 000)
- Ethiopia (13 000)
- Indonesia (8800)
- Pakistan (7900)
- United Republic of Tanzania (7900)
- Kenya (6300)
- China (5900)
- Uganda (5900)
Born Too Soon: The Global Action Report on Preterm Birth
Born Too Soon: The Global Action Report on Preterm Birth (2012) The first-ever country-by-country estimate of premature births finds that 15 million babies a year are born preterm - more than one in 10 live births. The report on preterm birth provides the first-ever national, regional and global estimates of preterm birth. The report shows the extent to which preterm birth is on the rise in most countries, and is now the second leading cause of death globally for children under five, after pneumonia. Preterm Birth
World Health Statistics
WHO's annual World Health Statistics reports present the most recent health statistics for the WHO Member States.
International Classification of Diseases
The World Health Organization's classification used worldwide as the standard diagnostic tool for epidemiology, health management and clinical purposes. This includes the analysis of the general health situation of population groups. It is used to monitor the incidence and prevalence of diseases and other health problems. Within this classification "congenital malformations, deformations and chromosomal abnormalities" are (Q00-Q99) but excludes "inborn errors of metabolism" (E70-E90).
International Classification of Diseases (ICD) ICD-10 was endorsed by the Forty-third World Health Assembly in May 1990 and came into use in WHO Member States as from 1994. The classification is the latest in a series which has its origins in the 1850s. The first edition, known as the International List of Causes of Death, was adopted by the International Statistical Institute in 1893. WHO took over the responsibility for the ICD at its creation in 1948 when the Sixth Revision, which included causes of morbidity for the first time, was published. The World Health Assembly adopted in 1967 the WHO Nomenclature Regulations that stipulate use of ICD in its most current revision for mortality and morbidity statistics by all Member States.
The ICD is the international standard diagnostic classification for all general epidemiological, many health management purposes and clinical use.
The World Health Report
WHO's annual World Health Statistics reports present the most recent health statistics for the WHO Member States. All reports are available for download in Adobe PDF and excel when applicable.
- Links: World Health Statistics | 2012 Report PDF
Australia
Australian Institute of Health and Welfare (AIHW)
BreastScreen Australia monitoring report 2011-2012
1 Oct 2014 [3]
The BreastScreen Australia monitoring report 2011-2012 presents the latest national statistics on this national screening program, which aims to reduce illness and death resulting from breast cancer through organised screening to detect cases of unsuspected breast cancer in women, thus enabling early intervention.
- Around 55% of women in the target age group of 50-69 took part in the program, with more than 1.7 million women screening in 2011-2012.
- Breast cancer mortality is at an historic low, at 44 deaths per 100,000 women.
- Links: Mammary Gland Development
Stillbirths in Australia 1991-2009
12 Sep 2014[1]
- In 2009, 2,341 babies were stillborn, accounting for almost three quarters of perinatal deaths.
- In Australia a 'stillbirth' is defined as the birth of a baby who shows no signs of life after a pregnancy of at least 20 weeks gestation or weighing 400 grams or more.
- Congenital anomalies, or birth defects, are the most common cause of stillbirth in Australia, accounting for 21% of all stillbirths.
- From 1991 to 2009, the stillbirth rate in Australia was between 6.4 and 7.8 per 1,000 births.
- The risk of stillbirth occurring between 28 and 41 weeks gestation dropped between 1991 and 2009, however there was an increase in the risk of stillbirths from 20-27 weeks.
Maternal deaths in Australia 2006-2010
19 Aug 2014[4]
Over the five years 2006-2010, there were 99 maternal deaths in Australia according to the report, Maternal deaths in Australia 2006-2010. This equates to a rate of 6.8 deaths per 100,000 women who gave birth in Australia. While lower than the rates for the previous three year reporting period 2003-2005 (8.4 deaths per 100,000 women who gave birth), and 2000-2002 (11.1 deaths per 100,000 women who gave birth), trends should be interpreted with caution due to the small numbers and the rare occurrence of these deaths.
In 2006-2010 there were 39 direct maternal deaths and 57 indirect deaths. Three deaths were not able to be classified as direct or indirect.
- leading causes of direct maternal death included embolism (a blockage of major blood vessels) caused by amniotic fluid (accounting for 9 deaths) or blood clot (8), and haemorrhage (7).
- leading cause of indirect maternal death was cardiac disease (15 deaths), followed by deaths due to psychosocial morbidity (related to mental health and substance abuse issues) (13 deaths).
- women who died were aged between 17 and 45 years, with women aged over 40 being at higher risk of maternal death.
- A higher number of previous pregnancies was also associated with increased risk, as was residing in Remote or Very remote areas.
- Indigenous women were about three times as likely to die as non-Indigenous women, with a maternal mortality rate of 16.4 deaths per 100,000 women giving birth (9 deaths).
- Sepsis and cardiac conditions have been the leading causes of maternal death among Indigenous women over the period 1997 to 2010.
- Links: Maternal Mortality | Australian Statistics | Birth
Foundations for enhanced maternity data collection and reporting in Australia: National maternity data development project - Stage 1
21 May 2014
- The aim of the project is to build a more comprehensive and consistent national data collection for maternal and perinatal health.
- National information needs for maternity data were identified and data development commenced.
- A system for classifying maternity models of care was developed and improved coordination of national maternal mortality data collection was implemented.
- Links: Report
National core maternity indicators
National core maternity indicators[5]
- National rates have decreased for smoking in pregnancy, episiotomy among women having their first baby and giving birth vaginally and the proportion of babies born weighing less than 2,750 grams at or after 40 weeks.
- However for some indicators, including induction of labour, caesarean section and instrumental vaginal birth, rates have increased and point to areas for possible further attention.
Assisted reproductive technology in Australia and New Zealand
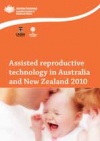
ART 2010 |
Assisted reproductive technology in Australia and New Zealand 2010[6] 26 Oct 2012
|
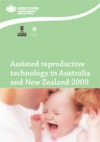
ART 2009 |
Assisted reproductive technology in Australia and New Zealand 2009.[7] 9 Nov 2011
|
Australia’s Mothers and Babies
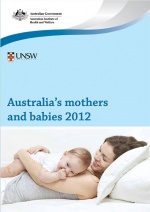
|
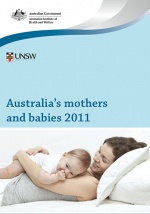
|
|
|
| Australia’s mothers and babies 2012 The latest released report is for 2012. | Australia’s mothers and babies 2011 The previous released report is for 2011. |
In 2012, 307,474 women gave birth to 312,153 babies in Australia. This was an increase of 10,343 births (3.4%) from that reported in 2011, and a total increase of 21.5% since 2003. Nationally, the proportion of teenage mothers (younger than 20) declined from 3.7% in 2011 to 3.6% in 2011, compared with 4.6% in 2003.
| 2009 - 2011 Data | ||
|---|---|---|
| Year | Live Births | Fetal Deaths |
| 2011 | 299,588 | 2,220 |
| 2010 | 299,563 | 2,206 |
| 2009 | 296,791 | 2,341 |
| 2008 | 294,737 | 2,188 |
| 2007 | 292,027 | 2,177 |
Report Summaries - 2010[8] | 2009[9] | 2008[10] | 2007[11]
Congenital Anomalies in Australia
Listed below are external links to the Congenital Congenital Malformations then Anomalies in Australia reports.
- Congenital Anomalies in Australia 2002-2003
- Congenital Anomalies in Australia 1998-2001
- Congenital Malformations Australia 1981-1997
- Congenital Malformations Australia 1995 and 1996
- Congenital Malformations Australia 1993 and 1994
- Congenital Malformations Australia 1981-1992
Other AIHW Reports
Listed below are a number of different AIHW reports that relate to reproduction and maternal health.
- A picture of Australia's children 2012[12]
- Neural tube defects in Australia: prevalence before mandatory folic acid fortification [13] 19 Dec 2011
- This report describes the prevalence and trends of neural tube defects (NTD) in Australia during the past decade.
- The best estimated prevalence of NTD among pregnancies is presented based on the information from states that collect near complete data on NTD.
- Characteristics and outcomes of the births and pregnancy characteristics of mothers are presented for the period 199-2008.
- The purpose of compiling this national report is to provide baseline prevalence of NTD, before implementation of mandatory folic acid fortification of bread flour in September 2009.
- Maternity data in Australia: a review of sources and gaps.[14] 13 Sep 2011 This bulletin presents the results of a review of the depth and breadth of maternal data capture in Australia. Gaps in national data were identified, as well as opportunities for future improvements, A key output of the review is the Maternity Information Matrix, an electronic inventory of maternity data collections and data items.
- Mandatory folic acid and iodine fortification in Australia and New Zealand: baseline report for monitoring[15] 11 May 2011
- The Australia and New Zealand Food Regulation Ministerial Council (the Ministerial Council) requested that Food Standards Australia New Zealand (FSANZ) consider mandatory folic acid fortification to help reduce the incidence of neural tube defects (NTDs) (serious birth defects), and mandatory iodine fortification to tackle the re-emergence of iodine deficiency in the population.
- In response, FSANZ developed two mandatory standards, effective from October 2009, which require the addition of folic acid to bread- making flour in Australia, and iodine (via iodised salt) to bread in Australia and New Zealand.
- This report presents baseline data for each component of the monitoring framework, and makes observations for future monitoring.
- Nursing and midwifery labour force 2008[16] 13 Oct 2010
- In 2008 the total number of registered and enrolled nurses estimated by the Nursing and Midwifery Labour Force Survey was 312,736, an increase of 10.6% since 2004.
- The nursing workforce continued to age between 1997 and 2008; the proportion of nurses aged 50 years or over increased from 18.9% to 34.4%.
- The number of full time equivalent nurses per 100,000 population increased by 15.2% between 2004 and 2008, and the profession continued to be predominantly female, with females comprising 91% of employed nurses in 2008.
- Diabetes in pregnancy: its impact on Australian women and their babies.[17]
- Diabetes is known to adversely affect women and their babies during pregnancy, labour and delivery.
- These adverse effects differ by type of diabetes and between population groups.
- This report is the first to explore these differences among Australian mothers and their babies at a national level, showing that: diabetes affects about 1 in 20 pregnancies; mothers with pre-existing Type 1 or Type 2 diabetes, and their babies, are at highest risk of adverse effects; mothers with gestational diabetes mellitus, and their babies, are also at increased risk; Aboriginal and Torres Strait Islander mothers and their babies are more likely to experience adverse effects than non-Indigenous mothers and their babies.
- Diabetes prevalence in Australia: detailed estimates.[18] (based on self-reports to the Australian Bureau of Statistics' 2007-08) 30 Jun 2011
- In 2007–08, an estimated 898,800 Australians had been diagnosed with diabetes (excluding gestational diabetes) at some time in their lives.
- 87,100 had been diagnosed with Type 1 diabetes.
- 787,500 had been diagnosed with Type 2 diabetes.
- 56% of those diagnosed with diabetes were male and 44% were female.
- About 96% of people with diabetes were 35 years old or more, and 43% were aged 65 years or more.
- The proportion of people with diabetes was similar in all states and territories, after accounting for differences in age.
- After accounting for differences in age, the proportion of people with diabetes was similar in major cities, regional areas and remote areas.
NSW Health
New South Wales Mothers and Babies Report 2010
- "The NSW Mothers and Babies Report 2010 provides information on recent trends in the health of mothers and babies in NSW, maternity services provided by hospitals, the health of Aboriginal mothers and babies, the health of mothers born overseas and their babies, and congenital conditions in babies."
- preterm birth (less than 37 weeks gestation) was 7.4%.
- rate of low birth weight (less than 2,500 grams) was 6.1%
- in Aboriginal or Torres Strait Islander babies was 11.2%.
- About 2% of infants are born with congenital conditions each year in NSW.
- In 2004–2010, anomalies of the cardiovascular system were most commonly reported, followed by anomalies of the musculoskeletal system and the genito-urinary system.
- Congenital conditions were more common among premature infants compared to full term infants, and among male infants compared to female infants.
- rate of congenital conditions increases with increasing maternal age, especially after age 35.
- However, as most babies are born to mothers aged less than 35 years, the majority of babies with congenital conditions were born to younger mothers.
- perinatal deaths 755, 134 (17.7%) of these deaths were unexplained stillbirths.
- neonatal death was extreme prematurity (41.3%), followed by congenital abnormalities (21.5%).
Data<refCentre for Epidemiology and Evidence. New South Wales Mothers and Babies 2010. Sydney: NSW Ministry of Health, 2012.</ref>
National Health and Medical Research Council
(NHMRC)
- Nutrient Reference Values for Australia and New Zealand Including Recommended Dietary Intakes.[19] 2006 PDF
- The Nutrient Reference Values outline the levels of intake of essential nutrients considered to be adequate to meet the known nutritional needs of practically all healthy people for prevention of deficiency states. The document can be used by health professionals to assess the likelihood of inadequate intake in individuals or groups of people.
- Links: Australian Statistics | Folic Acid and Neural Tube Defects | Iodine Deficiency | Nutrition | Maternal Diabetes
- Clinical Practice Guidelines on Magnesium Sulphate Prior to Preterm Birth for Neuroprotection of the Fetus, Infant and Child[20] PDF
- "The guideline recommendations outline the use of magnesium sulphate for pregnant women at imminent risk of preterm birth to reduce the risk of cerebral palsy and other adverse neurodevelopment outcomes."
Australian Government
Research Involving Embryos and Prohibition of Human Cloning Bill 2002
- The Research Involving Human Embryos Act 2002 and the Prohibition of Human Cloning Act 2002 were passed by Parliament in December 2002.
- These Acts establish a strong regulatory framework to prohibit certain unacceptable practices including human cloning, and to regulate uses of excess human embryos created though assisted reproductive technology (ART).
Definition in the Act
human embryo means a discrete entity that has arisen from either:
- (a) the first mitotic division when fertilisation of a human oocyte by a human sperm is complete; or
- (b) any other process that initiates organised development of a biological entity with a human nuclear genome or altered human nuclear genome that has the potential to develop up to, or beyond, the stage at which the primitive streak appears;
- and has not yet reached 8 weeks of development since the first mitotic division.
- Links: ComLaw | AustLII | National Library Australia | NHMRC
Human Embryo Experimentation in Australia 1985
Author: Australia. Parliament. Senate. Select Committee on the Human Embryo Experimentation Bill 1985.
Subjects: Human embryo -- Transplantation -- Moral and ethical aspects ; Embryology, Human -- Australia ; Embryology, Human -- Research -- Moral and ethical aspects ; Fertilization in vitro, Human -- Moral and ethical aspects ; Embryo Transfer ; Ethics, Medical -- Australia ; Human Experimentation Description: At head of title: The Parliament of the Commonwealth of Australia. AGPS cat. no. 8615096.
Publisher: Canberra : Australian Government Publishing Service
Date: 1986
Format: xxii, 158 p. ; 25 cm.
Language: English
Identifier: ISBN0644053100 :;ISBN0644053100
ILS API ID: NSW01000400201
- Links: National Library Australia | Open Library
USA
CDC/National Center for Health Statistics
|
CDC Report 2011 2009 Assisted Reproductive Technology Success Rates: National Summary and Fertility Clinic Reports. Atlanta: U.S. Department of Health and Human Services; 2011. http://www.cdc.gov/ART/ART2009
|
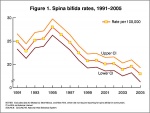
USA spina bifida rates |
CDC Report 2005 Trends in Spina Bifida and Anencephalus in the United States[21] In the U.S.A. the Food and Drug Administration in 1996 authorized that all enriched cereal grain products be fortified with folic acid, with optional fortification beginning in March 1996 and mandatory fortification in January 1998. The data in the report shows the subsequent changes in anencephaly and spina bifida rate over that period. |
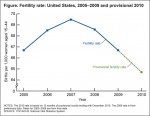
USA births fertility 2010 |
Recent Trends in Births and Fertility Rates Through 2010[22]
|
NIEHS - Early Pregnancy Study
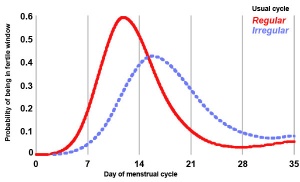
The original purpose of the Early Pregnancy Study (carried out in 1982-86) was to determine the extent of pregnancy loss that occurs before women know they are pregnant. To accomplish this, 221 healthy women who were planning to become pregnant were enrolled at the time they discontinued all methods of birth control. Study participants collected daily urine specimens and kept daily diaries of their intercourse and menstrual bleeding. Urine samples were assayed using a highly sensitive assay for human chorionic gonadotropin (hCG), the key hormone marker of pregnancy. About 25% of pregnancies detectable by hCG did not survive to become clinically recognized, being lost in bleeding that was mistaken as menstrual bleeding.
Further hormonal assays for estrogen and progesterone metabolites in urine made it possible to estimate the day of ovulation in each cycle. Once this key benchmark of the cycle was determined, a number of basic observations about normal pregnancy and its variations have been possible. These include the first accurate descriptions of the fertile days of the menstrual cycle (i.e., the five days before ovulation and the day of ovulation), the time of implantation (six to twelve days after conception) and the incidence of vaginal bleeding in the early days of healthy pregnancies.
National Academy of Sciences
- "In 2005, 12.5 percent of births in the United States were preterm, at less than 37 weeks gestation. This high rate of premature births in the United States constitutes a public health concern that costs society at least $26 billion a year."
- Links: USA Statistics | Birth - Preterm
Europe
Assisted reproductive technology in Europe, 2007: results generated from European registers by ESHRE
Hum Reprod. 2012 Apr;27(4):954-966. Epub 2012 Feb 17.
de Mouzon J, Goossens V, Bhattacharya S, Castilla JA, Ferraretti AP, Korsak V, Kupka M, Nygren KG, Andersen AN; The European IVF-Monitoring (EIM); Consortium for the European Society on Human Reproduction and Embryology (ESHRE). Source ESHRE Central Office, Meerstraat 60, B-1852 Grimbergen, Belgium.
Abstract
BACKGROUND This 11th European IVF-monitoring report presents the results of assisted reproductive technology (ART) treatments initiated in Europe during 2007. METHODS From 33 countries, 1029 clinics reported 493 184 treatment cycles: IVF (120 761), ICSI (256 642), frozen embryo replacement (91 145), egg donation (15 731), preimplantation genetic diagnosis/preimplantation genetic screening (4638), in vitro maturation (660) and frozen oocytes replacements (3607). Overall, this represents a 7.6% increase since 2006, mostly related to an increase in all registers. IUI using husband/partner's (IUI-H) and donor (IUI-D) semen was reported from 23 countries: 142 609 IUI-H (+6.2%) and 26 088 IUI-D (+7.2%). RESULTS In 18 countries where all clinics reported, 376 971 ART cycles were performed in a population of 425.6million (886 cycles per million). The clinical pregnancy rates per aspiration and per transfer were 29.1 and 32.8% for IVF, and 28.6 and 33.0% for ICSI. Delivery rate after IUI-H was 10.2% in women aged < 40 years. In IVF/ICSI cycles, 1, 2, 3 and ≥4 embryos were transferred in 21.4, 53.4, 22.7 and 2.5% of cycles, with no decline in the number of embryos per transfer since 2006. The proportion of multiple deliveries (22.3: 21.3% twin and 1.0% triplet), did not decrease compared with 2006 (20.8%) and 2005 (21.8%). In women < 40 years undergoing IUI-H, twin deliveries occurred in 11.7% and triplets in 0.5%. CONCLUSIONS In comparison with previous years, the reported number of ART cycles in Europe increased in 2007; pregnancy rates increased marginally, but the earlier decline in the number of embryos transferred and multiple births did not continue.
PMID 22343707
United Kingdom
Novel techniques for the prevention of mitochondrial DNA disorders: an ethical review
- Nuffield Council on Bioethics Report - Novel techniques for the prevention of mitochondrial DNA disorders: an ethical review | Executive Summary
- Technique
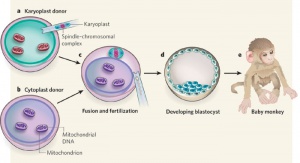
- Sep 2012 UK - Human Fertilisation and Embryology Authority (HFEA) launches a public consultation on the ethical and social implications of new in vitro fertilisation (IVF) techniques designed to avoid the maternal transmission of mitochondrial disease. Technique The oocyte normally provides the mitochondria to the embryo (maternally-derived), therefore a different oocyte cytoplasm with an affected mother's nucleus would prevent transmission of mitochondrial disease.
Why Mothers Die 2000–2002
- Confidential Enquiry into Maternal Deaths (CEMD)[24]
- Identified ectopic pregnancy as the fourth most common cause of maternal death (73% of early pregnancy deaths).
- Venous thrombosis and thromboembolism
- Hypertensive disease of pregnancy
- Haemorrhage
- Amniotic fluid embolism
- Early pregnancy (ectopic pregnancies)
- Genital tract sepsis
- Anaesthesia and intensive care
- Indirect deaths
- Links: United Kingdom Statistics
References
- ↑ 1.0 1.1 AIHW: Hilder L, Li Z, Zeki R & Sullivan EA 2014. Stillbirths in Australia 1991-2009. Perinatal statistics series no. 29. Cat. no. PER 63. Canberra: AIHW. http://www.aihw.gov.au/publication-detail/?id=60129548615
- ↑ AIHW 2014. Birthweight of babies born to Indigenous mothers. Cat. no. IHW 138. Canberra: AIHW. Viewed 5 August 2014 http://www.aihw.gov.au/publication-detail/?id=60129548202
- ↑ AIHW 2014. BreastScreen Australia monitoring report 2011-2012. Cancer series no. 86. Cat. no. CAN 83. Canberra: AIHW. http://www.aihw.gov.au/publication-detail/?id=60129548886
- ↑ Johnson S, Bonello MR, Li Z, Hilder L & Sullivan EA. 2014. Maternal deaths in Australia 2006-2010. Maternal deaths series no. 4. Cat. no. PER 61. Canberra: AIHW. AIHW
- ↑ AIHW National Perinatal Epidemiology and Statistics Unit and AIHW 2013. National core maternity indicators. Cat. no. PER 58. Canberra: AIHW.
- ↑ AIHW, Macaldowie A, Wang YA, Chambers GM & Sullivan EA 2012. Assisted reproductive technology in Australia and New Zealand 2010. Assisted reproduction technology series. Cat. no. PER 55. Canberra: AIHW. Online Summary | PDF
- ↑ Wang YA, Macaldowie A, Hayward I, Chambers GM, & Sullivan EA 2011. Assisted reproductive technology in Australia and New Zealand 2009. Assisted reproduction technology series no. 15. Cat. no. PER 51. Canberra: AIHW. Online Summary | PDF
- ↑ Li Z, Zeki R, Hilder L & Sullivan EA 2012. Australia's mothers and babies 2010. Perinatal statistics series no. 27. Cat. no. PER 57. Canberra: AIHW. Viewed 14 December 2012 <http://www.aihw.gov.au/publication-detail/?id=60129542376>
- ↑ Li Z, McNally L, Hilder L & Sullivan EA 2011. Australia’s mothers and babies 2009 Perinatal statistics series no. 25 Cat. no. PER 52. Sydney: AIHW National Perinatal Epidemiology and Statistics Unit.
- ↑ Laws P & Sullivan EA 2010. Australia's mothers and babies 2008 AIHW Perinatal statistics series no. 24 Cat. no. PER 48. Sydney: AIHW National Perinatal Statistics Unit.
- ↑ Laws P & Sullivan EA 2009. Australia's mothers and babies 2007 AIHW Perinatal statistics series no. 23 Cat. no. PER 48. Sydney: AIHW National Perinatal Statistics Unit.
- ↑ AIHW 2012. A picture of Australia's children 2012. Cat. no. PHE 167. Canberra: AIHW. http://www.aihw.gov.au/publication-detail/?id=10737423343
- ↑ AIHW National Perinatal Statistics Unit 2011. Neural tube defects in Australia: prevalence before mandatory folic acid fortification. Cat. no. PER 53. Canberra: AIHW. http://www.aihw.gov.au/publication-detail/?id=10737420864
- ↑ AIHW 2011. Maternity data in Australia: a review of sources and gaps. AIHW bulletin no.87. Cat. no. AUS 136. Canberra: AIHW.
- ↑ AIHW 2011. Mandatory folic acid and iodine fortification in Australia and New Zealand: baseline report for monitoring. Cat. no. PHE 139. Canberra: AIHW. Viewed 20 June 2011. PDF
- ↑ AIHW 2010. Nursing and midwifery labour force 2008. Cat. no. AUS 130. Canberra: AIHW. Viewed 29 June 2011 http://www.aihw.gov.au/publication-detail/?id=6442468396.
- ↑ Australian Institute of Health and Welfare 2010. Diabetes in pregnancy: its impact on Australian women and their babies. Diabetes series no. 14. Cat. no. CVD 52. Canberra: AIHW. AIHW | PDF
- ↑ AIHW 2011. Diabetes prevalence in Australia: detailed estimates. Diabetes series no. 17. Cat. no. CVD 56. Canberra: AIHW. Viewed 30 June 2011. http://www.aihw.gov.au/publication-detail/?id=10737419311
- ↑ Nutrient Reference Values for Australia and New Zealand Including Recommended Dietary Intakes. (2006) http://www.nhmrc.gov.au/publications/synopses/n35syn.htm PDF
- ↑ The Antenatal Magnesium Sulphate for Neuroprotection Guideline Development Panel. Antenatal magnesium sulphate prior to preterm birth for neuroprotection of the fetus, infant and child: National clinical practice guidelines. Adelaide: The University of Adelaide, 2010. PDF
- ↑ CDC Trends in Spina Bifida and Anencephalus in the United States, 1991-2005
- ↑ Sutton PD, Hamilton BE, Mathews TJ. Recent Trends in Births and Fertility Rates Through 2010 NCHS data brief MD: National Center for Health Statistics. 2011.online report | PDF
- ↑ Centers for Disease Control and Prevention. CDC Health Disparities and Inequalities Report - United States, 2011. MMWR 2011;60(Suppl):1-113. PDF
- ↑ Confidential Enquiry into Maternal Deaths (CEMD) Why Mothers Die 2000–2002 PDFPDF2
External Links
External Links Notice - The dynamic nature of the internet may mean that some of these listed links may no longer function. If the link no longer works search the web with the link text or name. Links to any external commercial sites are provided for information purposes only and should never be considered an endorsement. UNSW Embryology is provided as an educational resource with no clinical information or commercial affiliation.
- World Health Organization WHO | Publications
- Australian Institute of Health and Welfare Publications Catalogue | AIHW National Perinatal Statistics Unit
- National Health and Medical Research Council NHMRC | Publications
- National Library of Australia Catalogue
- Centers for Disease Control and Prevention CDC | Publications | Childhood Lead Poisoning Publications
Glossary Links
- Glossary: A | B | C | D | E | F | G | H | I | J | K | L | M | N | O | P | Q | R | S | T | U | V | W | X | Y | Z | Numbers | Symbols | Term Link
Cite this page: Hill, M.A. (2024, April 27) Embryology Reports. Retrieved from https://embryology.med.unsw.edu.au/embryology/index.php/Reports
- © Dr Mark Hill 2024, UNSW Embryology ISBN: 978 0 7334 2609 4 - UNSW CRICOS Provider Code No. 00098G
