Category:Mouse E15.5
The pages and media listed below relate to E15.5 mouse development.
- Mouse Stages: E1 | E2.5 | E3.0 | E3.5 | E4.5 | E5.0 | E5.5 | E6.0 | E7.0 | E7.5 | E8.0 | E8.5 | E9.0 | E9.5 | E10 | E10.5 | E11 | E11.5 | E12 | E12.5 | E13 | E13.5 | E14 | E14.5 | E15 | E15.5 | E16 | E16.5 | E17 | E17.5 | E18 | E18.5 | E19 | E20 | Timeline | About timed pregnancy
| Carnegie | Stage | |||||||||||||||||||||||
| Human | Days | 1 | 2-3 | 4-5 | 5-6 | 7-12 | 13-15 | 15-17 | 17-19 | 20 | 22 | 24 | 28 | 30 | 33 | 36 | 40 | 42 | 44 | 48 | 52 | 54 | 55 | 58 |
| Mouse | Days | 1 | 2 | 3 | E4.5 | E5.0 | E6.0 | E7.0 | E8.0 | E9.0 | E9.5 | E10 | E10.5 | E11 | E11.5 | E12 | E12.5 | E13 | E13.5 | E14 | E14.5 | E15 | E15.5 | E16 |
| Rat | Days | 1 | 3.5 | 4-5 | 5 | 6 | 7.5 | 8.5 | 9 | 10.5 | 11 | 11.5 | 12 | 12.5 | 13 | 13.5 | 14 | 14.5 | 15 | 15.5 | 16 | 16.5 | 17 | 17.5 |
| Note these Carnegie stages are only approximate day timings for average of embryos. Links: Carnegie Stage Comparison | ||||||||||||||||||||||||
| ||||||||||||||||||||||||
| Timeline Links: human timeline | mouse timeline | mouse detailed timeline | chicken timeline | rat timeline | Medaka | Category:Timeline |
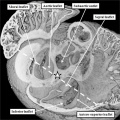
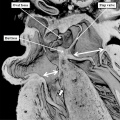
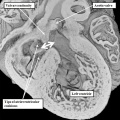
Heart - E15.5 (TS24) - E18.5 (TS27) Definitive external prenatal configuration achieved, Atrioventricular valve leaflets are being modified, Coronary arteries are being modified. [1]
- ↑ <pubmed>19359541</pubmed>| PMC2773446 | Toxicol Pathol.
Pages in category 'Mouse E15.5'
The following 2 pages are in this category, out of 2 total.
Media in category 'Mouse E15.5'
The following 21 files are in this category, out of 21 total.
 Anderson2016-fig28a.jpg 800 × 800; 117 KB
 Anderson2016-fig28b.jpg 800 × 800; 110 KB
 Anderson2016-fig34a.jpg 800 × 800; 105 KB
 Embryonic Trachea.png 468 × 326; 205 KB
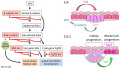 Integumentary touch dome model 01.jpg 1,280 × 724; 144 KB
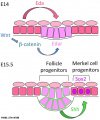 Integumentary touch dome model 03.jpg 603 × 724; 73 KB
 Mouse - palate MMP-25 expression.jpg 1,000 × 818; 243 KB
 Mouse cochlea gene expression.jpg 1,000 × 346; 75 KB
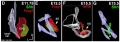
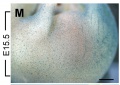
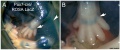
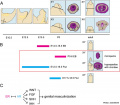 Mouse external genital development.jpg 800 × 701; 75 KB
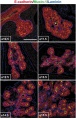
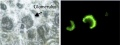
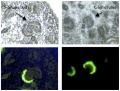
 Mouse gonad Gcnf expression 01.jpg 1,947 × 843; 304 KB
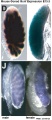 Mouse gonad Gcnf expression E15.5.jpg 338 × 782; 53 KB
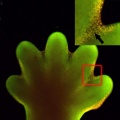 Mouse interdigit apoptosis 01.jpg 800 × 800; 81 KB
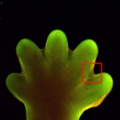 Mouse interdigit apoptosis 02.jpg 764 × 764; 61 KB
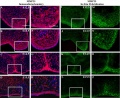
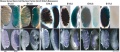
 Mouse melanoblast distribution 01.jpg 697 × 1,000; 192 KB
 Mouse melanoblast distribution 05.jpg 761 × 540; 94 KB
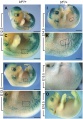
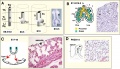
 Mouse pancreas development.jpg 600 × 939; 261 KB
 Mouse pax7 limb 01.jpg 1,320 × 549; 112 KB
 Mouse- respiratory development 01.jpg 1,000 × 571; 125 KB
 Renal - early glomerulus.jpg 1,155 × 432; 52 KB
 Renal - podocyte development 01.jpg 1,200 × 908; 155 KB
 Renal - S-shaped body stage.jpg 1,155 × 432; 99 KB


