Category:Mouse E13.5
The pages and media listed below relate to mouse embryonic day 13.5 E13.5 of development. This staging by "days" relate to in the female presence of a vaginal plug indicating that the mating occurred, see timed pregnancy.
- Mouse Stages: E1 | E2.5 | E3.0 | E3.5 | E4.5 | E5.0 | E5.5 | E6.0 | E7.0 | E7.5 | E8.0 | E8.5 | E9.0 | E9.5 | E10 | E10.5 | E11 | E11.5 | E12 | E12.5 | E13 | E13.5 | E14 | E14.5 | E15 | E15.5 | E16 | E16.5 | E17 | E17.5 | E18 | E18.5 | E19 | E20 | Timeline | About timed pregnancy
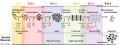
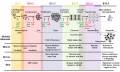
| Carnegie | Stage | |||||||||||||||||||||||
| Human | Days | 1 | 2-3 | 4-5 | 5-6 | 7-12 | 13-15 | 15-17 | 17-19 | 20 | 22 | 24 | 28 | 30 | 33 | 36 | 40 | 42 | 44 | 48 | 52 | 54 | 55 | 58 |
| Mouse | Days | 1 | 2 | 3 | E4.5 | E5.0 | E6.0 | E7.0 | E8.0 | E9.0 | E9.5 | E10 | E10.5 | E11 | E11.5 | E12 | E12.5 | E13 | E13.5 | E14 | E14.5 | E15 | E15.5 | E16 |
| Rat | Days | 1 | 3.5 | 4-5 | 5 | 6 | 7.5 | 8.5 | 9 | 10.5 | 11 | 11.5 | 12 | 12.5 | 13 | 13.5 | 14 | 14.5 | 15 | 15.5 | 16 | 16.5 | 17 | 17.5 |
| Note these Carnegie stages are only approximate day timings for average of embryos. Links: Carnegie Stage Comparison | ||||||||||||||||||||||||
| ||||||||||||||||||||||||
| Timeline Links: human timeline | mouse timeline | mouse detailed timeline | chicken timeline | rat timeline | Medaka | Category:Timeline |
Search Pubmed: Mouse E13.5
Pages in category 'Mouse E13.5'
The following 3 pages are in this category, out of 3 total.
Media in category 'Mouse E13.5'
The following 37 files are in this category, out of 37 total.
 Anderson2016-fig26a.jpg 800 × 800; 126 KB
 Anderson2016-fig26b.jpg 800 × 800; 103 KB
 Embryonic Trachea.png 468 × 326; 205 KB
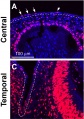
 Mouse - forebrain Robo3 expression.jpg 675 × 1,280; 289 KB
 Mouse - palate MMP-25 expression.jpg 1,000 × 818; 243 KB
 Mouse - stomach 01.png 599 × 600; 1.45 MB
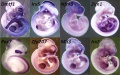
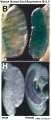
 Mouse Bmp4 expression face 01.jpg 1,200 × 322; 58 KB
 Mouse Bmp4 expression limb and face 01.jpg 1,200 × 513; 91 KB
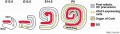 Mouse cochlea development cartoon.jpg 1,000 × 280; 53 KB
 Mouse cochlea gene expression.jpg 1,000 × 346; 75 KB
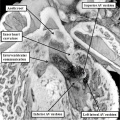
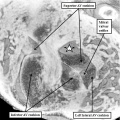
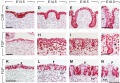
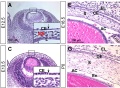 Mouse cornea development 01.jpg 1,200 × 880; 325 KB
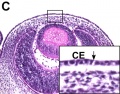 Mouse cornea E13.5.jpg 700 × 550; 103 KB
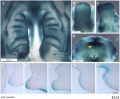 Mouse E13.5 Bmp7 palate 1.jpg 1,200 × 993; 156 KB
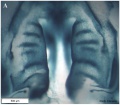 Mouse E13.5 Bmp7 palate 2.jpg 917 × 800; 88 KB
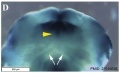 Mouse E13.5 Bmp7 palate 3.jpg 800 × 488; 40 KB
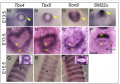
 Mouse E13.5 gene expression.jpg 1,764 × 1,100; 266 KB
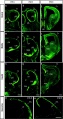
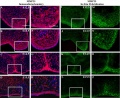
 Mouse eye cell proliferation E13.5.jpg 875 × 1,244; 227 KB
 Mouse eye neural crest.jpg 1,086 × 1,509; 483 KB
 Mouse face Bmp4.mp4 ; 480 KB
 Mouse gonad Gcnf expression 01.jpg 1,947 × 843; 304 KB
 Mouse gonad Gcnf expression E13.5.jpg 332 × 784; 60 KB
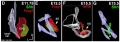
 Mouse limb bone development timeline.jpg 1,256 × 469; 107 KB
 Mouse limb skeleton cartoon.jpg 1,000 × 487; 64 KB
 Mouse limb tissue development.jpg 1,280 × 767; 161 KB
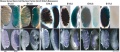
 Mouse melanoblast distribution 01.jpg 697 × 1,000; 192 KB
 Mouse melanoblast distribution 03.jpg 751 × 1,051; 150 KB
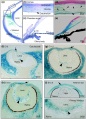
 Mouse model of ovarian cord formation 01.jpg 800 × 491; 85 KB
 Mouse model of ovarian cord formation.jpg 800 × 491; 85 KB
 Mouse pancreas development.jpg 600 × 939; 261 KB
 Mouse respiratory 36 to 60 somites.jpg 1,200 × 383; 58 KB
 Mouse spleen capsulin expression.jpg 960 × 670; 226 KB
 Mouse thyroid Hes1 model.jpg 600 × 364; 33 KB
 Mouse tongue Pax9 expression 01.jpg 1,200 × 687; 259 KB
 Mouse tongue Pax9 expression 02.jpg 1,200 × 833; 299 KB
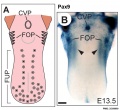 Mouse tongue Pax9 expression 03.jpg 1,091 × 1,000; 145 KB
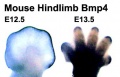 Mouse- hindlimb Bmp4 expression.jpg 374 × 241; 19 KB
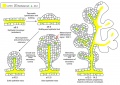 Mouse-pancreas duct formation.jpg 1,000 × 709; 154 KB


