File:World population graph02.jpg: Difference between revisions
From Embryology
(==World Population Graph== Countries with more than 100 million population (2011). Category:Statistics Category:Graph) |
mNo edit summary |
||
| Line 3: | Line 3: | ||
Countries with more than 100 million population (2011). | Countries with more than 100 million population (2011). | ||
[[Category:Statistics]] [[Category:Graph]] | {{Footer}} | ||
[[Category:Statistics]] [[Category:Graph]][[Category:2010's]] | |||
Revision as of 12:01, 5 March 2019
World Population Graph
Countries with more than 100 million population (2011).
Cite this page: Hill, M.A. (2024, June 1) Embryology World population graph02.jpg. Retrieved from https://embryology.med.unsw.edu.au/embryology/index.php/File:World_population_graph02.jpg
- © Dr Mark Hill 2024, UNSW Embryology ISBN: 978 0 7334 2609 4 - UNSW CRICOS Provider Code No. 00098G
File history
Click on a date/time to view the file as it appeared at that time.
| Date/Time | Thumbnail | Dimensions | User | Comment | |
|---|---|---|---|---|---|
| current | 01:18, 5 June 2011 | 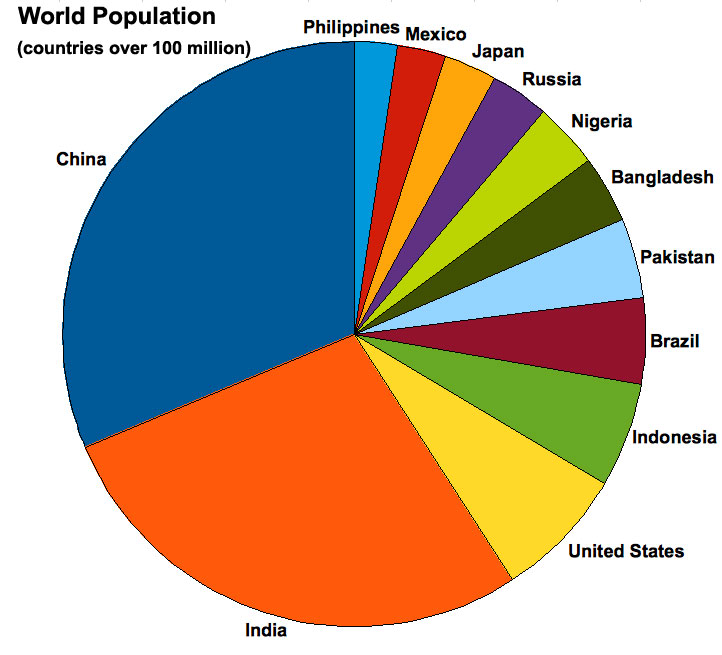 | 722 × 655 (70 KB) | S8600021 (talk | contribs) | ==World Population Graph== Countries with more than 100 million population (2011). Category:Statistics Category:Graph |
You cannot overwrite this file.
File usage
The following 4 pages use this file: