File:Abnormal AusData81-92Graph.png: Difference between revisions
No edit summary |
No edit summary |
||
| Line 9: | Line 9: | ||
Image Source: UNSW Embryology http://embryology.med.unsw.edu.au/Defect/page3.htm | Image Source: UNSW Embryology http://embryology.med.unsw.edu.au/Defect/page3.htm | ||
==Reference== | ===Reference=== | ||
Congenital Malformations Australia 1981-1992, P. Lancaster and E. Pedisich, ISSN 1321-8352. | Congenital Malformations Australia 1981-1992, P. Lancaster and E. Pedisich, ISSN 1321-8352. | ||
| Line 15: | Line 15: | ||
[[Category:Prenatal Diagnosis]] [[Category:Abnormal Development]] [[Category:Genetic Abnormalities]] [[Category:Human Embryo]] [[Category:Human Fetus]] | [[Category:Prenatal Diagnosis]] [[Category:Abnormal Development]] [[Category:Genetic Abnormalities]] [[Category:Human Embryo]] [[Category:Human Fetus]] [[Category:Congenital Malformations Australia 81-92]] | ||
[[Category:Neural]] [[Category:Australia]] [[Category:Statistics]] | [[Category:Neural]] [[Category:Australia]] [[Category:Statistics]] | ||
Revision as of 10:31, 10 July 2012
Abnormal Development - Australia (1981-1992)
Graph shows the percentage of developmental abnormalities by categories of all notifiable birth defects in Australia.
Data groupings and classification as Major or Minor Abnormalities are based on that used by the Australian Institute of Health and Welfare National Perinatal Statistics Unit, UNSW and published in Congenital Malformations Australia 1981-92.
For individual systems, data shown as a % of all Major Abnormalities based upon published statistics using the same groupings as CMA 81-92. Please note that some congenital diseases involve more than one system.
Image Source: UNSW Embryology http://embryology.med.unsw.edu.au/Defect/page3.htm
Reference
Congenital Malformations Australia 1981-1992, P. Lancaster and E. Pedisich, ISSN 1321-8352.
File history
Yi efo/eka'e gwa ebo wo le nyangagi wuncin ye kamina wunga tinya nan
| Gwalagizhi | Nyangagi | Dimensions | User | Comment | |
|---|---|---|---|---|---|
| current | 14:16, 12 August 2009 | 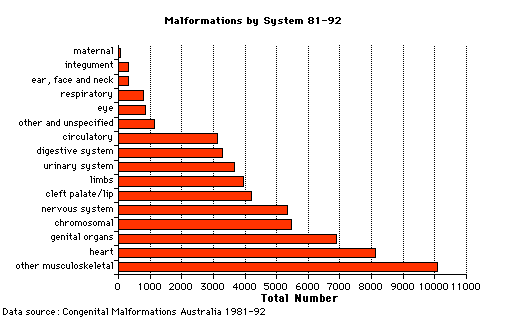 | 509 × 320 (7 KB) | MarkHill (talk | contribs) | Pie diagram shows the percentage of developmental abnormalities by categories of all notifiable birth defects in Australia. Data groupings and classification as Major or Minor Abnormalities are based on that used by the Australian Institute of Health and |
You cannot overwrite this file.
File usage
The following 11 pages use this file:
- 2010 BGD Practical 12 - Abnormalities
- 2010 Lecture 1
- 2011 Lab 12 - Abnormalities
- ANAT2341 Lab 12 - Abnormalities
- Abnormal Development - Unknown
- BGDA Practical 12 - Abnormalities
- Human Abnormal Development
- Lecture - 2011 Course Introduction
- Lecture - 2012 Course Introduction
- Lecture - 2013 Course Introduction
- Renal System - Abnormalities