File:Mouse somitogenesis genes.jpg
Original file (828 × 800 pixels, file size: 119 KB, MIME type: image/jpeg)
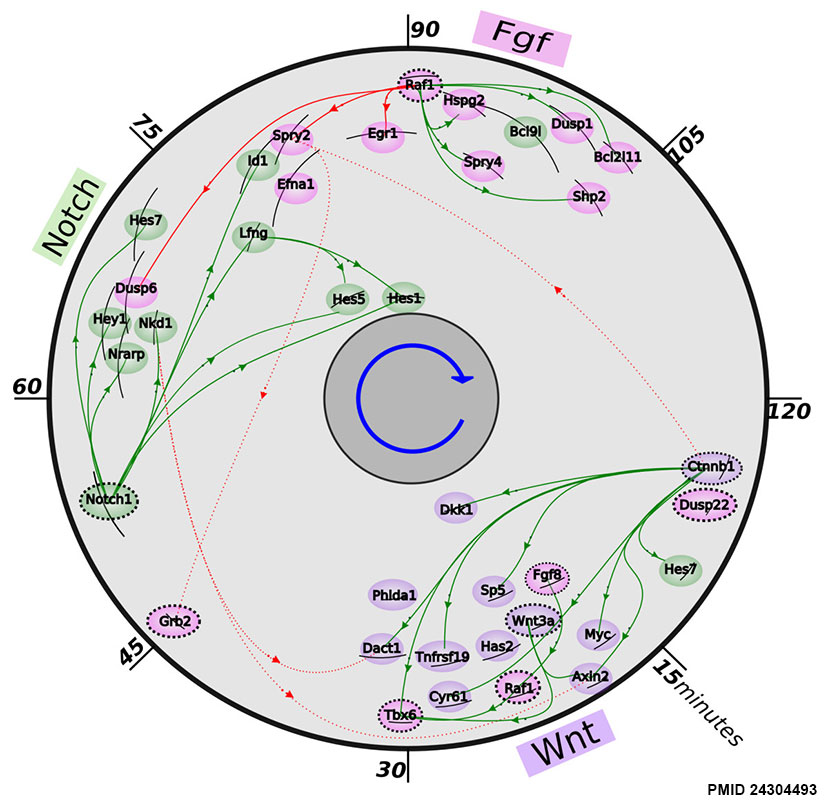
Gene Regulation During Mouse Somitogenesis
Position of a gene symbol on the plot reflects time of peak expression (angle; clockwise) and the mean expression level (genes with high expression level are closer to the center). Arrows represent the known causation (green arrows connect genes in the causation direction matching those found in the literature and red arrows are in the reverse causation order. Dot links are between genes too distant to indicate direction of causation). Solid black arcs represent the estimated timing accuracy for each gene. Causation directions are compiled from literature [1-10]. Genes are color-coded according to their known pathway association with green for Notch, magenta for Fgf, purple for Wnt; in addition, dashed strokes are used for genes previously not reported as cyclic.
Reference
<pubmed>24304493</pubmed>| BMC Dev Biol.
Copyright
© 2013 Fongang and Kudlicki; licensee BioMed Central Ltd. This is an open access article distributed under the terms of the Creative Commons Attribution License (http://creativecommons.org/licenses/by/2.0), which permits unrestricted use, distribution, and reproduction in any medium, provided the original work is properly cited.
Figure 3. Gene regulation during mouse somitogenesis.
File history
Click on a date/time to view the file as it appeared at that time.
| Date/Time | Thumbnail | Dimensions | User | Comment | |
|---|---|---|---|---|---|
| current | 19:42, 28 December 2013 | | 828 × 800 (119 KB) | Z8600021 (talk | contribs) | ==Gene Regulation During Mouse Somitogenesis== Position of a gene symbol on the plot reflects time of peak expression (angle; clockwise) and the mean expression level (genes with high expression level are closer to the center). Arrows represent the kn... |
You cannot overwrite this file.
File usage
The following 4 pages use this file: