File:Mouse somitogenesis genes.jpg: Difference between revisions
mNo edit summary |
|||
| Line 4: | Line 4: | ||
* Arrows represent the known causation (green arrows connect genes in the causation direction matching those found in the literature and red arrows are in the reverse causation order. | * Arrows represent the known causation (green arrows connect genes in the causation direction matching those found in the literature and red arrows are in the reverse causation order. | ||
* Dot links are between genes too distant to indicate direction of causation). | * Dot links are between genes too distant to indicate direction of causation). | ||
* Solid black arcs represent the estimated timing accuracy for each gene. Causation directions are compiled from literature. | * Solid black arcs represent the estimated timing accuracy for each gene. Causation directions are compiled from literature. | ||
* Genes are color-coded according to their known pathway association: | * Genes are color-coded according to their known pathway association: | ||
** green - Notch | ** green - Notch | ||
** magenta - Fgf | ** magenta - Fgf | ||
** purple - Wnt | ** purple - Wnt | ||
* dashed strokes are used for genes previously not reported as cyclic. | * dashed strokes are used for genes previously not reported as cyclic. | ||
:'''Links:''' | :'''Links:''' {{Somitogenesis}} | {{Notch}} | {{FGF}} | {{Wnt}} | [[Molecular Development]] | ||
Latest revision as of 06:48, 12 December 2018
Gene Regulation During Mouse Somitogenesis
Position of a gene symbol on the plot reflects time of peak expression (angle; clockwise) and the mean expression level (genes with high expression level are closer to the center).
- Arrows represent the known causation (green arrows connect genes in the causation direction matching those found in the literature and red arrows are in the reverse causation order.
- Dot links are between genes too distant to indicate direction of causation).
- Solid black arcs represent the estimated timing accuracy for each gene. Causation directions are compiled from literature.
- Genes are color-coded according to their known pathway association:
- green - Notch
- magenta - Fgf
- purple - Wnt
- dashed strokes are used for genes previously not reported as cyclic.
- Links: somitogenesis | Notch | FGF | Wnt | Molecular Development
Reference
Fongang B & Kudlicki A. (2013). The precise timeline of transcriptional regulation reveals causation in mouse somitogenesis network. BMC Dev. Biol. , 13, 42. PMID: 24304493 DOI.
Copyright
© 2013 Fongang and Kudlicki; licensee BioMed Central Ltd. This is an open access article distributed under the terms of the Creative Commons Attribution License (http://creativecommons.org/licenses/by/2.0), which permits unrestricted use, distribution, and reproduction in any medium, provided the original work is properly cited.
Figure 3. Gene regulation during mouse somitogenesis.
Cite this page: Hill, M.A. (2024, May 2) Embryology Mouse somitogenesis genes.jpg. Retrieved from https://embryology.med.unsw.edu.au/embryology/index.php/File:Mouse_somitogenesis_genes.jpg
- © Dr Mark Hill 2024, UNSW Embryology ISBN: 978 0 7334 2609 4 - UNSW CRICOS Provider Code No. 00098G
File history
Click on a date/time to view the file as it appeared at that time.
| Date/Time | Thumbnail | Dimensions | User | Comment | |
|---|---|---|---|---|---|
| current | 19:42, 28 December 2013 | 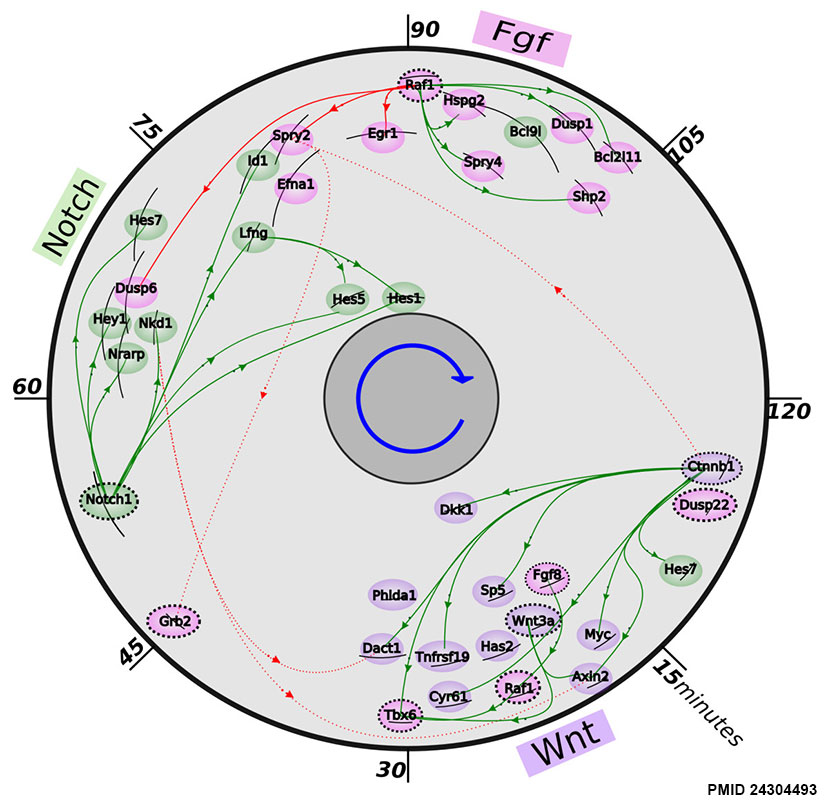 | 828 × 800 (119 KB) | Z8600021 (talk | contribs) | ==Gene Regulation During Mouse Somitogenesis== Position of a gene symbol on the plot reflects time of peak expression (angle; clockwise) and the mean expression level (genes with high expression level are closer to the center). Arrows represent the kn... |
You cannot overwrite this file.
File usage
The following 4 pages use this file: