File:Human development timeline graph 02.jpg
From Embryology
No higher resolution available.
Human_development_timeline_graph_02.jpg (800 × 424 pixels, file size: 61 KB, MIME type: image/jpeg)
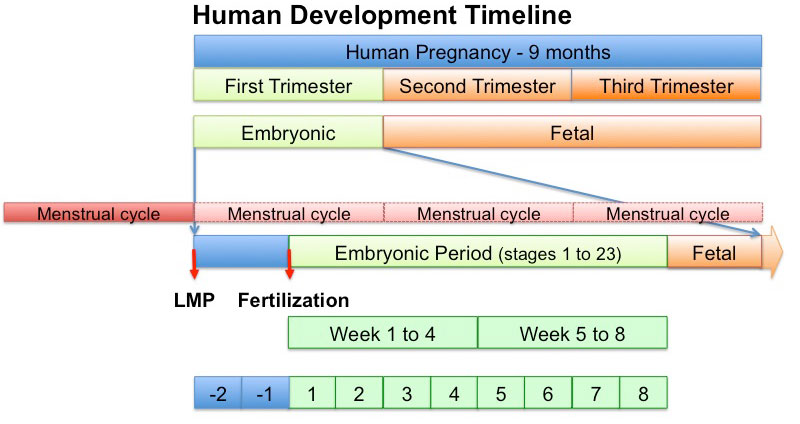
Human Development Timeline
Simplified graphical view of human development timeline. The focus upon embryonic development. Start from the top of the figure and work your way down for more detail.
|
|
File history
Click on a date/time to view the file as it appeared at that time.
| Date/Time | Thumbnail | Dimensions | User | Comment | |
|---|---|---|---|---|---|
| current | 11:56, 10 April 2011 | | 800 × 424 (61 KB) | S8600021 (talk | contribs) |
You cannot overwrite this file.
File usage
The following 20 pages use this file:
- ANZACA Meeting 2012 - Embryology
- BGDA Lecture - Development of the Embryo/Fetus 1
- BGDA Lecture - Development of the Embryo/Fetus 2
- BGDA Practical - Fetal Development
- BGDA Practical - Implantation to 8 Weeks
- Brain Awareness Week 2012
- Fertilization Age
- Foundations Lecture - Introduction to Human Development
- Gestational Age
- K12 Brain Awareness Week
- Lecture - 2012 Course Introduction
- Lecture - 2013 Course Introduction
- Lecture - 2014 Course Introduction
- Lecture - 2015 Course Introduction
- Lecture - 2016 Course Introduction
- Lecture - 2017 Course Introduction
- Menstrual Cycle
- Museum of Natural History Berlin - 2013 Seminar
- Talk:ANAT2341 Lab 11
- Talk:Lecture - 2016 Course Introduction