File:Human development timeline graph 01.jpg: Difference between revisions
From Embryology
(uploaded a new version of "File:Human development timeline graph 01.jpg") |
|||
| Line 6: | Line 6: | ||
'''Note:''' | '''Note:''' | ||
* '''LMP''' - Last Menstrual Period, last day is used to calculate the clinical Gestational Age (GA). | |||
* '''Fertilization''' - can only occur after ovulation, about the midpoint (day 14) of what would have been the next cycle. About 2 weeks different from GA. | |||
* All timings are only approximate. | * All timings are only approximate. | ||
* The sequence is important. | * The sequence is important. | ||
Revision as of 11:28, 25 October 2012
Human Development Timeline
This graph shows an overview of human development and details about embryonic development.
Start from the top of the figure and work your way down for more detail.
Note:
- LMP - Last Menstrual Period, last day is used to calculate the clinical Gestational Age (GA).
- Fertilization - can only occur after ovulation, about the midpoint (day 14) of what would have been the next cycle. About 2 weeks different from GA.
- All timings are only approximate.
- The sequence is important.
- Hormonal changes shown are those during a normal menstrual cycle.
- Hormonal changes would be different following fertilization and implantation.
- Links: Simplified Graph | Quicktime Graph | Flash Graph | Timeline - Detailed
File history
Yi efo/eka'e gwa ebo wo le nyangagi wuncin ye kamina wunga tinya nan
| Gwalagizhi | Nyangagi | Dimensions | User | Comment | |
|---|---|---|---|---|---|
| current | 14:31, 20 Mayıs 2011 | 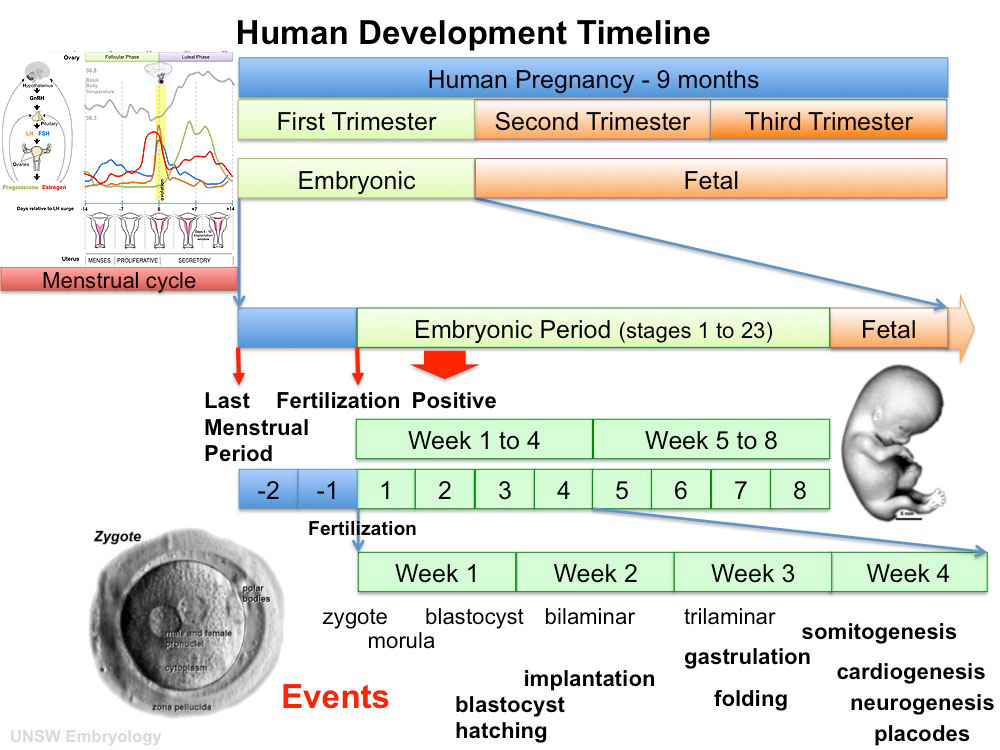 | 1,000 × 750 (141 KB) | S8600021 (talk | contribs) | |
| 22:14, 10 April 2011 | 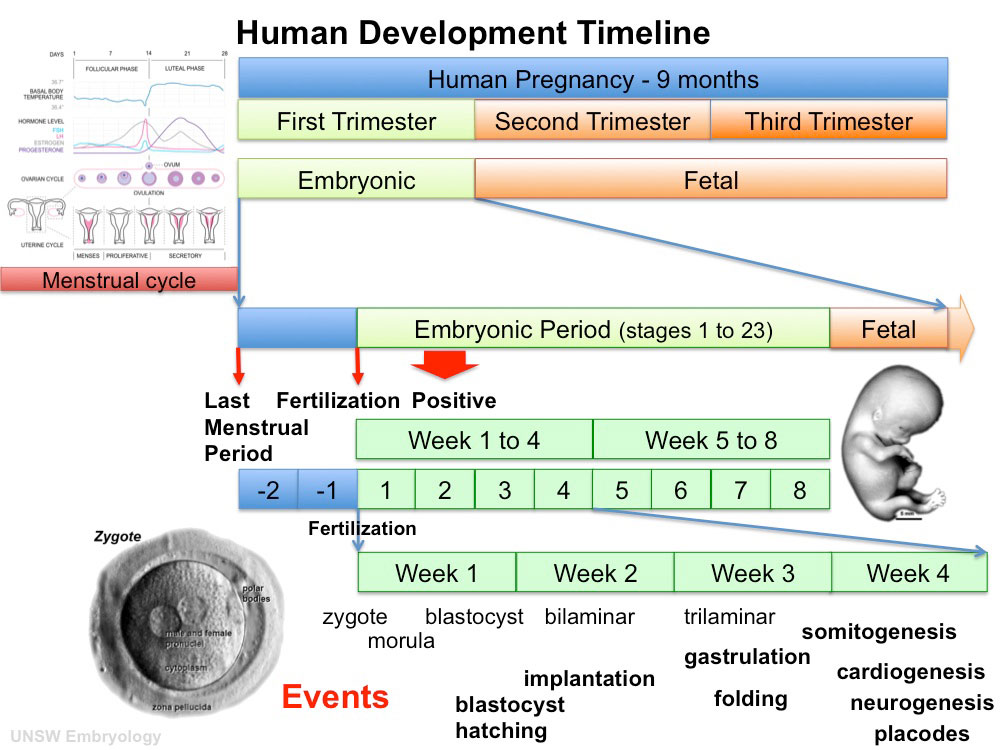 | 1,000 × 750 (134 KB) | S8600021 (talk | contribs) | ||
| 19:18, 10 April 2011 |  | 800 × 600 (98 KB) | S8600021 (talk | contribs) |
You cannot overwrite this file.
File usage
The following 12 pages use this file:
- ANAT2341 Lab 1 2013
- BGDA Practical - Fertilization to Implantation
- BGDA Practical 3 - Week 3 Summary
- Fetal ECHO Meeting 2012
- Foundations Lecture - Introduction to Human Development
- Foundations Practical - Week 1 to 8
- Human Development Timeline Movie
- Lecture - Week 3 Development
- Pre-Medicine Program - Embryology
- RPAH Cardiac Embryology 2014
- Timeline human development
- Talk:Flash Movies


