File:Tectum signaling model 01.jpg
Tectum_signaling_model_01.jpg (600 × 314 pixels, file size: 41 KB, MIME type: image/jpeg)
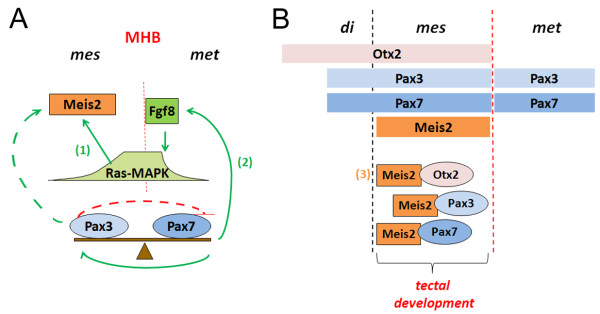
Tectum Development Signaling Model
Model for a possible cooperation of Meis2, Pax3, Pax7 and Otx2 during tectal development.
- MHB - mid-hindbrain boundary
Red lines indicate negative regulation, green arrows positive regulation. Dashed lines indicate hypothetical direct regulation of the Meis2 promoter/enhancer by different Pax3 concentrations. Solid lines indicate indirect regulation of Meis2 expression via Pax3/7 mediated induction of Fgf8 as previously reported:
- Regulation of Meis2 expression in response to Ras-MAPK signaling levels
- Induction of Fgf8 by Pax3 and Pax7
- Existence of Meis2-Otx2 containing protein complexes in the tectal anlage
- Links: tectum
Reference
Agoston Z, Li N, Haslinger A, Wizenmann A & Schulte D. (2012). Genetic and physical interaction of Meis2, Pax3 and Pax7 during dorsal midbrain development. BMC Dev. Biol. , 12, 10. PMID: 22390724 DOI.
Copyright
© 2012 Agoston et al; licensee BioMed Central Ltd.
This is an Open Access article distributed under the terms of the Creative Commons Attribution License (http://creativecommons.org/licenses/by/2.0), which permits unrestricted use, distribution, and reproduction in any medium, provided the original work is properly cited.
Agoston et al. BMC Developmental Biology 2012 12:10 doi:10.1186/1471-213X-12-10
1471-213X-12-10-6.jpg
Cite this page: Hill, M.A. (2024, April 28) Embryology Tectum signaling model 01.jpg. Retrieved from https://embryology.med.unsw.edu.au/embryology/index.php/File:Tectum_signaling_model_01.jpg
- © Dr Mark Hill 2024, UNSW Embryology ISBN: 978 0 7334 2609 4 - UNSW CRICOS Provider Code No. 00098G
File history
Click on a date/time to view the file as it appeared at that time.
| Date/Time | Thumbnail | Dimensions | User | Comment | |
|---|---|---|---|---|---|
| current | 07:50, 11 June 2012 | | 600 × 314 (41 KB) | Z8600021 (talk | contribs) | ==Tectum Development Signaling Model== Model for a possible cooperation of Meis2, Pax3, Pax7 and Otx2during tectal development. Red lines indicate negative regulation, green arrows positive regulation. Dashed lines indicate hypothetical direct regulat |
You cannot overwrite this file.
File usage
The following page uses this file: