File:Normal distribution curve.jpg: Difference between revisions
From Embryology
| (One intermediate revision by the same user not shown) | |||
| Line 3: | Line 3: | ||
The normal distribution (or Gaussian distribution) is a continuous probability distribution that is often used as a first approximation to describe real-valued random variables that tend to cluster around a single mean value. | The normal distribution (or Gaussian distribution) is a continuous probability distribution that is often used as a first approximation to describe real-valued random variables that tend to cluster around a single mean value. | ||
'''<font color= | '''<font color=crimson>Red curve</font>''' - normal distribution (or Gaussian distribution) | ||
Image Source: File:Normal_Distribution_PDF.svg http://en.wikipedia.org/wiki/File:Normal_Distribution_PDF.svg | Image Source: File:Normal_Distribution_PDF.svg http://en.wikipedia.org/wiki/File:Normal_Distribution_PDF.svg | ||
Latest revision as of 10:16, 11 October 2010
Normal distribution curve
The normal distribution (or Gaussian distribution) is a continuous probability distribution that is often used as a first approximation to describe real-valued random variables that tend to cluster around a single mean value.
Red curve - normal distribution (or Gaussian distribution)
Image Source: File:Normal_Distribution_PDF.svg http://en.wikipedia.org/wiki/File:Normal_Distribution_PDF.svg
File history
Click on a date/time to view the file as it appeared at that time.
| Date/Time | Thumbnail | Dimensions | User | Comment | |
|---|---|---|---|---|---|
| current | 10:14, 11 October 2010 | 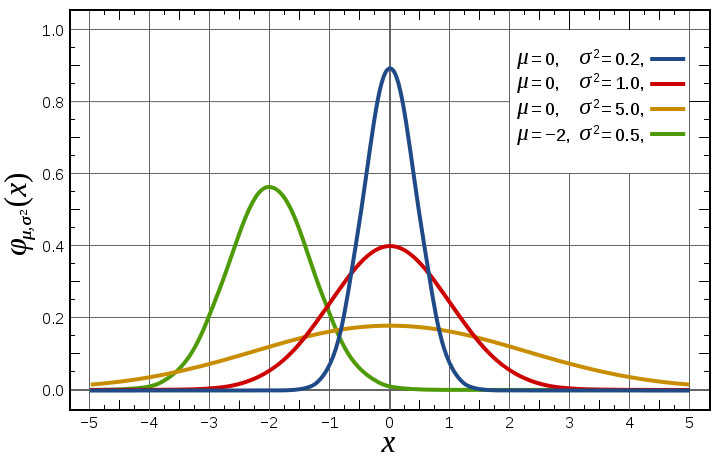 | 720 × 460 (52 KB) | S8600021 (talk | contribs) | ==Normal distribution curve== The normal distribution (or Gaussian distribution) is a continuous probability distribution that is often used as a first approximation to describe real-valued random variables that tend to cluster around a single mean value |
You cannot overwrite this file.
File usage
The following 3 pages use this file: