File:Mouse CT axes E11.5.jpg: Difference between revisions
No edit summary |
No edit summary |
||
| (2 intermediate revisions by one other user not shown) | |||
| Line 1: | Line 1: | ||
==Mouse Embryo Computed Tomography== | ==Mouse Embryo Computed Tomography== | ||
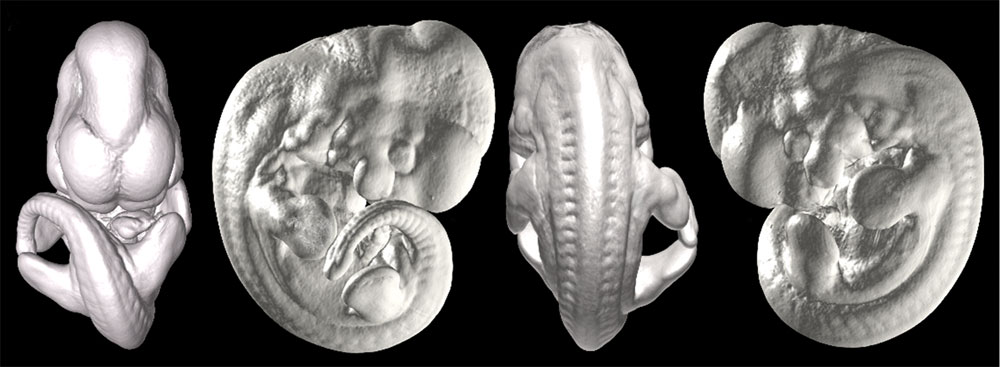
Isosurface of E11.5 | Isosurface of of the CT-scanned embryo E11.5 scanned at 8-μm resolution. | ||
:''' | :'''Links:''' [[Mouse Development]] | [[:Category:Mouse E11.5|Category:Mouse E11.5]] | ||
==Reference== | |||
: | <pubmed>16683035</pubmed>| [http://www.plosgenetics.org/article/info:doi/10.1371/journal.pgen.0020061 PLoS Genetics] | ||
doi | |||
Citation: Johnson JT, Hansen MS, Wu I, Healy LJ, Johnson CR, et al. (2006) Virtual Histology of Transgenic Mouse Embryos for High-Throughput Phenotyping. PLoS Genet 2(4): e61. doi:10.1371/journal.pgen.0020061 | Citation: Johnson JT, Hansen MS, Wu I, Healy LJ, Johnson CR, et al. (2006) Virtual Histology of Transgenic Mouse Embryos for High-Throughput Phenotyping. PLoS Genet 2(4): e61. doi:10.1371/journal.pgen.0020061 | ||
| Line 28: | Line 20: | ||
Copyright: © 2006 Johnson et al. This is an open-access article distributed under the terms of the Creative Commons Attribution License, which permits unrestricted use, distribution, and reproduction in any medium, provided the original author and source are credited. | Copyright: © 2006 Johnson et al. This is an open-access article distributed under the terms of the Creative Commons Attribution License, which permits unrestricted use, distribution, and reproduction in any medium, provided the original author and source are credited. | ||
Original File Name: journal.pgen.0020061.g001.tif (only A of figure is shown here) | |||
[[Category:Mouse]] [[Category:Computed Tomography]] [[Category:Mouse E11.5]] | [[Category:Mouse]] [[Category:Computed Tomography]] [[Category:Mouse E11.5]] | ||
Latest revision as of 17:24, 22 June 2012
Mouse Embryo Computed Tomography
Isosurface of of the CT-scanned embryo E11.5 scanned at 8-μm resolution.
- Links: Mouse Development | Category:Mouse E11.5
Reference
<pubmed>16683035</pubmed>| PLoS Genetics
Citation: Johnson JT, Hansen MS, Wu I, Healy LJ, Johnson CR, et al. (2006) Virtual Histology of Transgenic Mouse Embryos for High-Throughput Phenotyping. PLoS Genet 2(4): e61. doi:10.1371/journal.pgen.0020061
Editor: Wayne Frankel, The Jackson Laboratory, United States of America
Received: January 23, 2006; Accepted: March 13, 2006; Published: April 28, 2006
Copyright: © 2006 Johnson et al. This is an open-access article distributed under the terms of the Creative Commons Attribution License, which permits unrestricted use, distribution, and reproduction in any medium, provided the original author and source are credited.
Original File Name: journal.pgen.0020061.g001.tif (only A of figure is shown here)
File history
Click on a date/time to view the file as it appeared at that time.
| Date/Time | Thumbnail | Dimensions | User | Comment | |
|---|---|---|---|---|---|
| current | 01:03, 16 April 2010 | 1,000 × 367 (68 KB) | S8600021 (talk | contribs) | Comparison of Virtual and Paraffin Histology of an E11.5 Embryo Scanned at 8 μm (A) Isosurface renderings of the CT-scanned embryo. (B) Maximum intensity projection of the same embryo, with overlying places of section. (C–E) Sagittal, coronal, and a |
You cannot overwrite this file.
File usage
The following 5 pages use this file: