File:Human development timeline graph 01.jpg
From Embryology
Size of this preview: 800 × 600 pixels. Other resolution: 1,000 × 750 pixels.
Original file (1,000 × 750 pixels, file size: 141 KB, MIME type: image/jpeg)
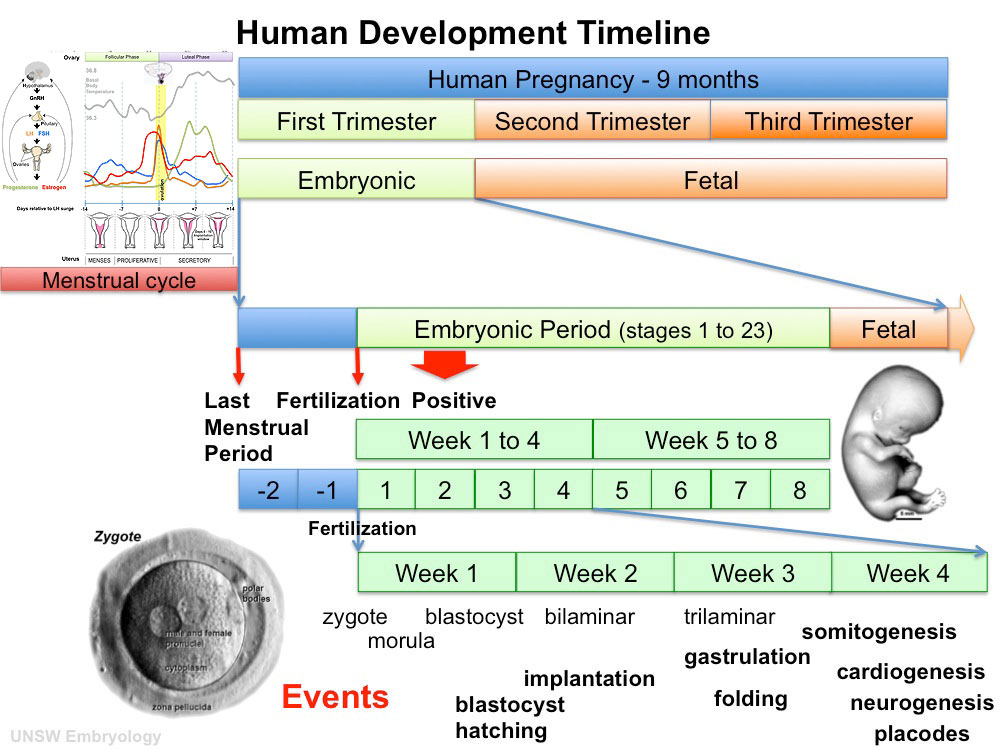
Human Development Timeline
This graph shows an overview of human development and details about embryonic development.
Note:
- All timings are only approximate.
- The sequence is important.
- Hormonal changes shown are those during a normal menstrual cycle.
- Hormonal changes would be different following fertilization and implantation.
- Links: Simplified Graph | Quicktime Graph | Flash Graph | Timeline - Detailed
File history
Click on a date/time to view the file as it appeared at that time.
| Date/Time | Thumbnail | Dimensions | User | Comment | |
|---|---|---|---|---|---|
| current | 13:31, 20 May 2011 | | 1,000 × 750 (141 KB) | S8600021 (talk | contribs) | |
| 21:14, 10 April 2011 |  | 1,000 × 750 (134 KB) | S8600021 (talk | contribs) | ||
| 18:18, 10 April 2011 |  | 800 × 600 (98 KB) | S8600021 (talk | contribs) |
You cannot overwrite this file.
File usage
The following 12 pages use this file:
- ANAT2341 Lab 1 2013
- BGDA Practical - Fertilization to Implantation
- BGDA Practical 3 - Week 3 Summary
- Fetal ECHO Meeting 2012
- Foundations Lecture - Introduction to Human Development
- Foundations Practical - Week 1 to 8
- Human Development Timeline Movie
- Lecture - Week 3 Development
- Pre-Medicine Program - Embryology
- RPAH Cardiac Embryology 2014
- Timeline human development
- Talk:Flash Movies