File:Adult female fibroblast and lymphocyte nuclear DNA 01.jpg: Difference between revisions
From Embryology
(Figure 7. Localization of Alu Sequences in Nuclei of Fibroblasts and Lymphocytes (A) Karyotype from a female human lymphocyte (46, XX). Chromosomes were hybridized with a probe for Alu sequences (green) and counterstained with TOPRO-3 (red). Alu sequen...) |
mNo edit summary |
||
| Line 1: | Line 1: | ||
==Localization of Alu Sequences in Nuclei of Fibroblasts and Lymphocytes== | |||
* '''A''' - Karyotype from a female human lymphocyte (46, XX). Chromosomes were hybridized with a probe for Alu sequences (green) and counterstained with TOPRO-3 (red). Alu sequences were used as a marker for chromosomes and chromosome bands rich in genes. | |||
* '''B and C''' - Confocal serial sections were obtained from a human G0 fibroblast nucleus (B) and a G0 lymphocyte nucleus from peripheral blood (C) after 3D FISH with the Alu probe (green) and TOPRO-3 counterstaining (red). As examples, sections made at the top, middle, and bottom of the nuclei (separated by about 1 μm) are shown from left to right. Scale bars, 5 μm. | |||
* '''D''' - Enlarged confocal mid-section through the human G0 fibroblast nucleus. Scale bar, 5 μm. | |||
* '''E''' - Enlargement of the boxed sector in (D). The color image in the middle reflects the merged images left (TOPRO-3 counterstaining, red) and right (Alu staining, green). Arrows indicate chromatin rich in Alu sequences expanding into the TOPRO-3-stained, Alu-poor nuclear rim. Scale bar, 2 μm. | |||
{{cell nuclear DNA links}} | |||
===Reference=== | |||
<pubmed>15839726</pubmed>| [http://www.plosbiology.org/article/info%3Adoi%2F10.1371%2Fjournal.pbio.0030157 PLoS Biol.] | |||
====Copyright==== | |||
© 2005 Bolzer et al. This is an open-access article distributed under the terms of the Creative Commons Attribution License, which permits unrestricted use, distribution, and reproduction in any medium, provided the original work is properly cited. | |||
Bolzer | |||
PMID | Figure 7. doi:10.1371/journal.pbio.0030157.g007 PMID--15839726journal.pbio.0030157.g007.jpg | ||
[[Category:Human]][[Category:Adult]][[Category:Female]] | |||
Revision as of 12:33, 16 October 2014
Localization of Alu Sequences in Nuclei of Fibroblasts and Lymphocytes
- A - Karyotype from a female human lymphocyte (46, XX). Chromosomes were hybridized with a probe for Alu sequences (green) and counterstained with TOPRO-3 (red). Alu sequences were used as a marker for chromosomes and chromosome bands rich in genes.
- B and C - Confocal serial sections were obtained from a human G0 fibroblast nucleus (B) and a G0 lymphocyte nucleus from peripheral blood (C) after 3D FISH with the Alu probe (green) and TOPRO-3 counterstaining (red). As examples, sections made at the top, middle, and bottom of the nuclei (separated by about 1 μm) are shown from left to right. Scale bars, 5 μm.
- D - Enlarged confocal mid-section through the human G0 fibroblast nucleus. Scale bar, 5 μm.
- E - Enlargement of the boxed sector in (D). The color image in the middle reflects the merged images left (TOPRO-3 counterstaining, red) and right (Alu staining, green). Arrows indicate chromatin rich in Alu sequences expanding into the TOPRO-3-stained, Alu-poor nuclear rim. Scale bar, 2 μm.
- Genetics Links: Image - Female karyotype and nucleus gene locations | Image - Female karyotype | |Image - Female fibroblast nucleus gene locations | Cartoon - nucleus structure | Genetics
Reference
<pubmed>15839726</pubmed>| PLoS Biol.
Copyright
© 2005 Bolzer et al. This is an open-access article distributed under the terms of the Creative Commons Attribution License, which permits unrestricted use, distribution, and reproduction in any medium, provided the original work is properly cited.
Figure 7. doi:10.1371/journal.pbio.0030157.g007 PMID--15839726journal.pbio.0030157.g007.jpg
File history
Click on a date/time to view the file as it appeared at that time.
| Date/Time | Thumbnail | Dimensions | User | Comment | |
|---|---|---|---|---|---|
| current | 12:25, 16 October 2014 | 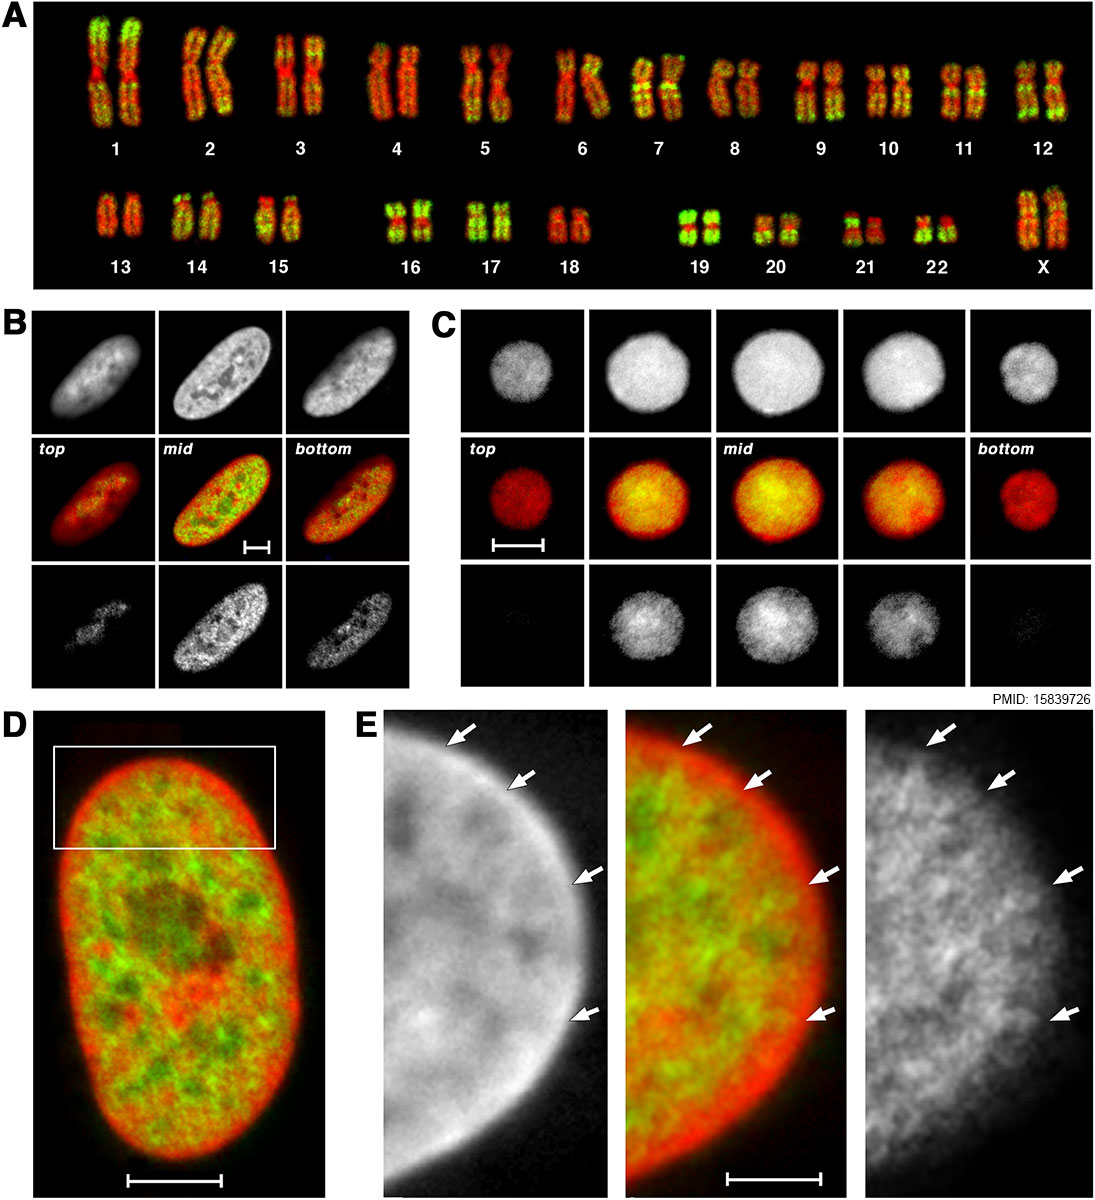 | 1,095 × 1,200 (197 KB) | Z8600021 (talk | contribs) | Figure 7. Localization of Alu Sequences in Nuclei of Fibroblasts and Lymphocytes (A) Karyotype from a female human lymphocyte (46, XX). Chromosomes were hybridized with a probe for Alu sequences (green) and counterstained with TOPRO-3 (red). Alu sequen... |
You cannot overwrite this file.
File usage
There are no pages that use this file.