File:Abnormal AusData81-92.png
Abnormal_AusData81-92.png (523 × 358 pixels, file size: 10 KB, MIME type: image/png)
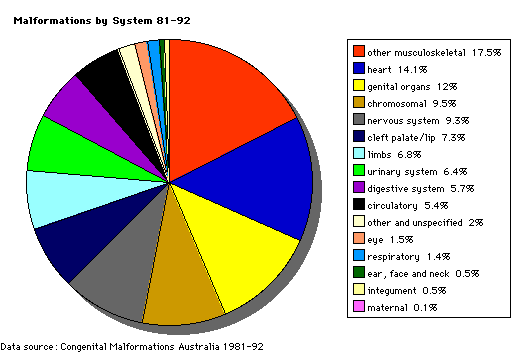
Pie diagram shows the percentage of developmental abnormalities by categories of all notifiable birth defects in Australia.
Data groupings and classification as Major or Minor Abnormalities are based on that used by the Australian Institute of Health and Welfare National Perinatal Statistics Unit, UNSW and published in Congenital Malformations Australia 1981-92.
For individual systems, data shown as a % of all Major Abnormalities based upon published statistics using the same groupings as CMA 81-92. Please note that some congenital diseases involve more than one system.
Reference: Original Data source for graphs from Congenital Malformations Australia 1981-1992, P. Lancaster and E. Pedisich, ISSN 1321-8352.
Image Source: UNSW Embryology http://embryology.med.unsw.edu.au/Defect/page3.htm
File history
Click on a date/time to view the file as it appeared at that time.
| Date/Time | Thumbnail | Dimensions | User | Comment | |
|---|---|---|---|---|---|
| current | 14:13, 12 August 2009 | | 523 × 358 (10 KB) | MarkHill (talk | contribs) | Pie diagram shows the percentage of developmental abnormalities by categories of all notifiable birth defects in Australia. Data groupings and classification as Major or Minor Abnormalities are based on that used by the Australian Institute of Health and |
You cannot overwrite this file.
File usage
The following 10 pages use this file:
- 2010 BGD Practical 12 - Abnormalities
- 2010 BGD Tutorial - Applied Embryology and Teratology
- 2011 Lab 12 - Abnormalities
- ANAT2341 Lab 12 - Abnormalities
- Abnormal Development - Australian Statistics
- Australian Statistics
- BGDA Practical 12 - Abnormalities
- BGDA Tutorial - Embryology
- BGD Tutorial - Applied Embryology and Teratology
- Foundations Practical - Critical Periods