Category:Placode: Difference between revisions
From Embryology
(Created page with 'The pages and media below are UNSW Embryology content that relates to placode development, the term used to describe the process of generation of a series of paired specialized e…') |
No edit summary |
||
| Line 1: | Line 1: | ||
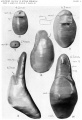
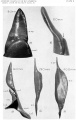
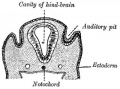
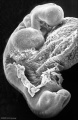
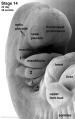
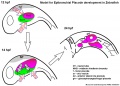
The pages and media below are UNSW Embryology content that relates to placode development, the term used to describe the process of generation of a series of paired specialized ectodermal thickenings in the head region. | The pages and media below are UNSW Embryology content that relates to placode development, the term used to describe the process of generation of a series of paired specialized ectodermal thickenings in the head region. | ||
[[Category:Sensory]] | |||
[[Category:Head]] | |||
[[Category:Ectoderm]] | |||
Revision as of 23:20, 9 August 2012
The pages and media below are UNSW Embryology content that relates to placode development, the term used to describe the process of generation of a series of paired specialized ectodermal thickenings in the head region.
Pages in category 'Placode'
The following 27 pages are in this category, out of 27 total.
C
P
W
Media in category 'Placode'
The following 52 files are in this category, out of 52 total.
 Anson1934 fig01-8.jpg 1,337 × 888; 126 KB
 Anson1934 fig09.jpg 546 × 272; 16 KB
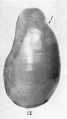
 Anson1934 fig10.jpg 520 × 612; 31 KB
 Anson1934 fig11.jpg 758 × 870; 52 KB
 Anson1934 fig12.jpg 545 × 968; 44 KB
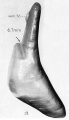 Anson1934 fig13.jpg 761 × 1,323; 74 KB
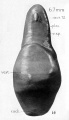 Anson1934 fig14.jpg 761 × 1,323; 81 KB
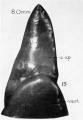 Anson1934 fig15.jpg 693 × 1,003; 62 KB
 Anson1934 fig16.jpg 691 × 985; 47 KB
 Anson1934 fig17.jpg 605 × 1,143; 57 KB
 Anson1934 fig18.jpg 418 × 1,161; 34 KB
 Anson1934 fig19.jpg 524 × 1,218; 48 KB
 Anson1934 plate01.jpg 1,557 × 2,279; 288 KB
 Anson1934 plate02.jpg 1,464 × 2,311; 259 KB
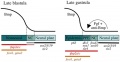
 Drosophila and mouse placode similarity.jpg 499 × 1,086; 337 KB
 Golby1928 fig01.jpg 1,000 × 632; 87 KB
 Golby1928 fig05.jpg 707 × 542; 51 KB
 Gray0898.jpg 400 × 295; 26 KB
 Gray0899.jpg 300 × 180; 9 KB
 Mouse otic placode gene expression 01.jpg 358 × 677; 86 KB
 Mouse otic placode gene expression 02.jpg 500 × 486; 100 KB
 Neural domain.jpg 452 × 778; 54 KB
 Preplacodal development model.jpg 800 × 416; 41 KB
 Stage 13 image 060.jpg 1,000 × 486; 96 KB
 Stage 13 image 061.jpg 1,000 × 600; 101 KB
 Stage11 sem20.jpg 668 × 1,000; 132 KB
 Stage12 sem1.jpg 472 × 1,000; 69 KB
 Stage12 sem2.jpg 1,787 × 2,303; 313 KB
 Stage12 sem2a.jpg 776 × 1,000; 100 KB
 Stage12 sem2b.jpg 621 × 800; 73 KB
 Stage12 sem2c.jpg 466 × 600; 47 KB
 Stage12 sem3c.jpg 389 × 600; 43 KB
 Stage12 sem4.jpg 1,245 × 1,693; 242 KB
 Stage12 sem4a.jpg 735 × 1,000; 107 KB
 Stage12 sem4b.jpg 588 × 800; 76 KB
 Stage12 sem4c.jpg 441 × 600; 47 KB
 Stage12 sem5.jpg 1,245 × 1,695; 217 KB
 Stage12 sem5a.jpg 735 × 1,000; 103 KB
 Stage12 sem5b.jpg 588 × 800; 74 KB
 Stage12 sem5c.jpg 441 × 600; 47 KB
 Stage12 sem7.jpg 2,520 × 2,715; 479 KB
 Stage12 sem7a.jpg 1,000 × 1,077; 139 KB
 Stage12 sem7b.jpg 800 × 862; 102 KB
 Stage12 sem7c.jpg 600 × 647; 68 KB
 Stage12 sem8.jpg 1,376 × 2,123; 299 KB
 Stage12 sem8a.jpg 648 × 1,000; 107 KB
 Stage12 sem8b.jpg 518 × 800; 78 KB
 Stage12 sem8c.jpg 389 × 600; 51 KB
 Stage14 sem2al.jpg 504 × 800; 68 KB
 Stage14 sem2cl.jpg 252 × 400; 22 KB
 Stage14 sem2l.jpg 630 × 1,000; 96 KB
 Zebrafish placode model.jpg 800 × 575; 82 KB


