File:Acute otitis media infection age graph01.png
From Embryology

Size of this preview: 800 × 494 pixels. Other resolution: 1,280 × 791 pixels.
Original file (1,280 × 791 pixels, file size: 77 KB, MIME type: image/png)
Summary
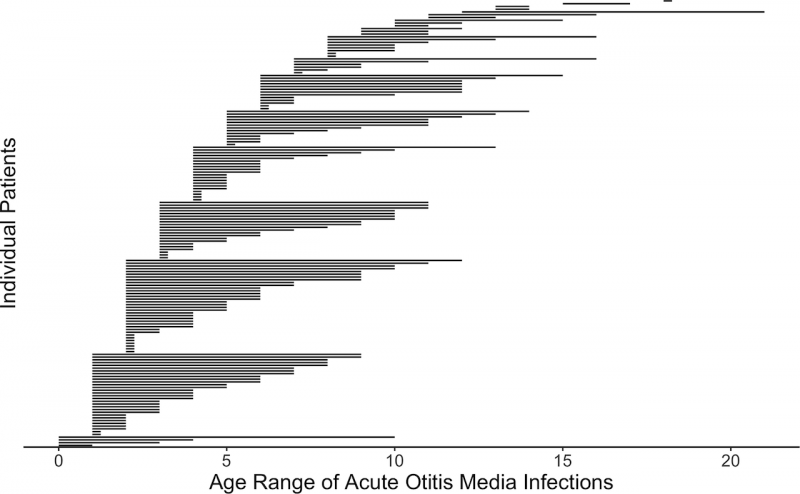
Fig 3. Age range of AOM infections. Each line represents an individual patient. N = 162 represents all patients who had at least one AOM infection. https://doi.org/10.1371/journal.pone.0212777.g003
acute otitis media (AOM) infection
Copyright: © 2019 Norowitz et al. This is an open access article distributed under the terms of the Creative Commons Attribution License, which permits unrestricted use, distribution, and reproduction in any medium, provided the original author and source are credited.
File history
Yi efo/eka'e gwa ebo wo le nyangagi wuncin ye kamina wunga tinya nan
| Gwalagizhi | Nyangagi | Dimensions | User | Comment | |
|---|---|---|---|---|---|
| current | 09:55, 12 April 2019 |  | 1,280 × 791 (77 KB) | Z8600021 (talk | contribs) | Fig 3. Age range of AOM infections. Each line represents an individual patient. N = 162 represents all patients who had at least one AOM infection. https://doi.org/10.1371/journal.pone.0212777.g003 acute otitis media (AOM) infection Copyright: © 201... |
You cannot overwrite this file.
File usage
The following 2 pages use this file: