File:Mouse-Gastrointestinal-tract-E10.5-01.jpg

Original file (1,000 × 306 pixels, file size: 43 KB, MIME type: image/jpeg)
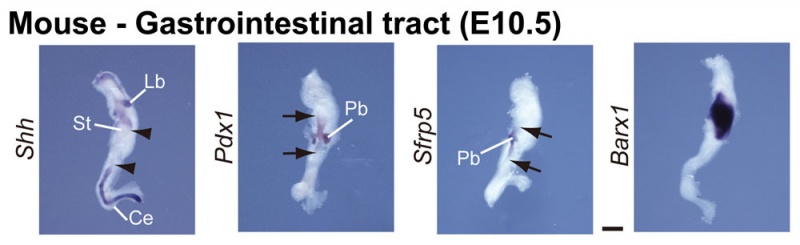
Mouse Gastrointestinal tract (E10.5)
This image has been edited from (Figure 1) showing only the normal mouse gene expression at E10.5.
- Links: Full original figure | Mouse-Gastrointestinal tract E10.5 | Mouse-Gastrointestinal tract E13.5
E10.5
A region of presumptive stomach and duodenum is generated normally in Sfrp1−/− Sfrp2−/− and Sfrp1−/− Sfrp2−/− Sfrp5+/− embryos at E10.5, which is suggested by the expression patterns of Shh (F), Pdx1 (G), Sfrp5 (H) and Barx1 (I). The area between the arrowheads identifies a Shh-negative region in the gut epithelium (F). Arrows depict the rostral and caudal ends of marker gene expression (G, H). Ce, cecum; Lb, lung bud; Pb, pancreatic bud; St, stomach.
Scale bar: 500 µm.
Original Image: Figure 1. Journal.pgen.1000427.g001.png
Reference
<pubmed>19300477</pubmed>| PLoS Genet.
Copyright: © 2009 Matsuyama et al. This is an open-access article distributed under the terms of the Creative Commons Attribution License, which permits unrestricted use, distribution, and reproduction in any medium, provided the original author and source are credited.
File history
Yi efo/eka'e gwa ebo wo le nyangagi wuncin ye kamina wunga tinya nan
| Gwalagizhi | Nyangagi | Dimensions | User | Comment | |
|---|---|---|---|---|---|
| current | 11:59, 22 August 2010 | 1,000 × 306 (43 KB) | S8600021 (talk | contribs) | ==Mouse Gastrointestinal tract (E10.5)== This image has been edited from (Figure 1) showing only the normal mouse gene expression at E10.5. :Links: Full original figure | [[:File:Mouse-Gastrointestinal-tract-E13.5-01.jpg |
You cannot overwrite this file.
File usage
The following 3 pages use this file: