File:Mouse-Gastrointestinal-tract-E10.5-01.jpg

Original file (1,000 × 306 pixels, file size: 43 KB, MIME type: image/jpeg)
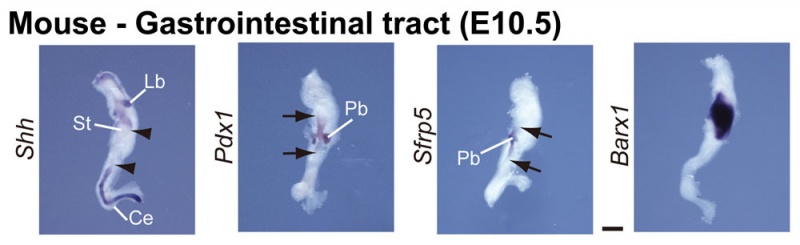
Mouse Gastrointestinal tract (E10.5)
This image has been edited from (Figure 1) showing only the normal mouse gene expression at E10.5.
E10.5
A region of presumptive stomach and duodenum is generated normally in Sfrp1−/− Sfrp2−/− and Sfrp1−/− Sfrp2−/− Sfrp5+/− embryos at E10.5, which is suggested by the expression patterns of Shh (F), Pdx1 (G), Sfrp5 (H) and Barx1 (I). The area between the arrowheads identifies a Shh-negative region in the gut epithelium (F). Arrows depict the rostral and caudal ends of marker gene expression (G, H). Ce, cecum; Lb, lung bud; Pb, pancreatic bud; St, stomach.
Scale bar: 500 µm.
Original Image: Figure 1. Journal.pgen.1000427.g001.png
File history
Yi efo/eka'e gwa ebo wo le nyangagi wuncin ye kamina wunga tinya nan
| Gwalagizhi | Nyangagi | Dimensions | User | Comment | |
|---|---|---|---|---|---|
| current | 11:59, 22 August 2010 | 1,000 × 306 (43 KB) | S8600021 (talk | contribs) | ==Mouse Gastrointestinal tract (E10.5)== This image has been edited from (Figure 1) showing only the normal mouse gene expression at E10.5. :Links: Full original figure | [[:File:Mouse-Gastrointestinal-tract-E13.5-01.jpg |
You cannot overwrite this file.
File usage
The following 3 pages use this file: