File:Bovine GIT miRNA expression 01.jpg
Original file (815 × 800 pixels, file size: 93 KB, MIME type: image/jpeg)
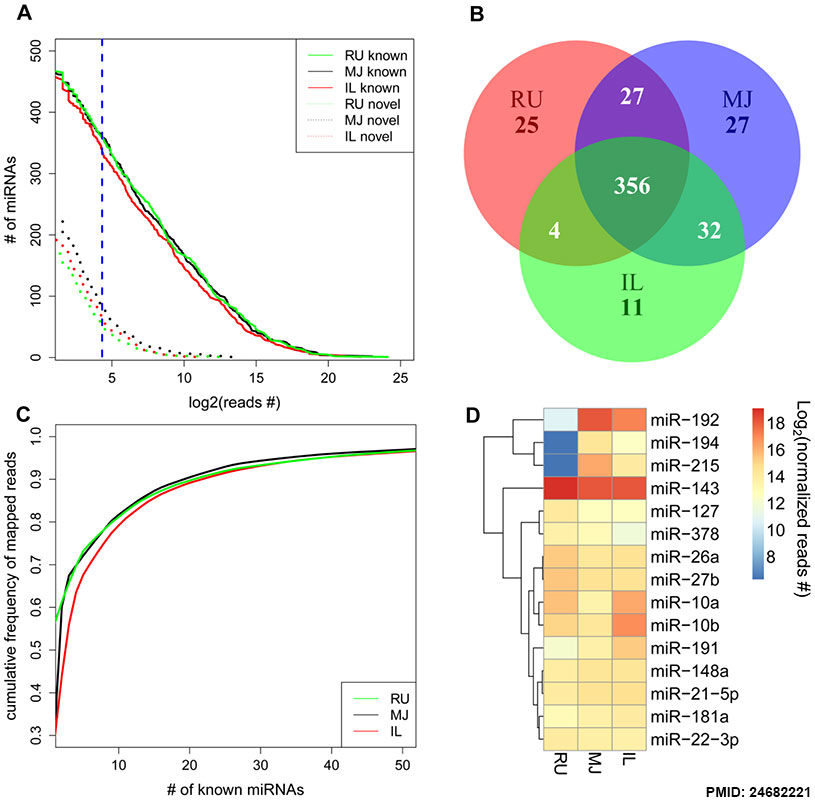
Overview of miRNAs detected in the GIT of dairy calves during early life using miRNA sequencing. (A). Numbers of known (solid line) and novel miRNAs (dotted line) identified (total reads number for each tissue >20, blue line). (B). Comparison of the number of known miRNAs detected in rumen (RU), mid-jejunum (MJ), and ileum (IL). (C). Cumulative frequency of known miRNAs detected in rumen (RU), mid-jejunum (MJ), and ileum (IL). (D). Comparative expression of top 10 highly expressed miRNAs in rumen (RU), mid-jejunum (MJ), and ileum (IL) using Heatmap.2 function in R package. Colors represent different normalised sequencing reads number as indicated by the color bar.
Figure 1. doi:10.1371/journal.pone.0092592.g001
PLoS One. 2014 Mar 28;9(3):e92592. doi: 10.1371/journal.pone.0092592. eCollection 2014.
Potential Regulatory Role of MicroRNAs in the Development of Bovine Gastrointestinal Tract during Early Life.
Liang G1, Malmuthuge N1, McFadden TB2, Bao H1, Griebel PJ3, Stothard P1, Guan LL1.
Author information
Abstract This study aimed to investigate the potential regulatory role of miRNAs in the development of gastrointestinal tract (GIT) during the early life of dairy calves. Rumen and small intestinal (mid-jejunum and ileum) tissue samples were collected from newborn (30 min after birth; n = 3), 7-day-old (n = 6), 21-day-old (n = 6), and 42-day-old (n = 6) dairy calves. The miRNA profiling was performed using Illumina RNA-sequencing and the temporal and regional differentially expressed miRNAs were further validated using qRT-PCR. Analysis of 16S rRNA gene copy numbers was used to quantify total bacteria, Bifidobacterium and Lactobacillus species. The expression of miR-143 was abundant in all three gut regions, at all time points and it targets genes involved primarily in the proliferation of connective tissue cells and muscle cells, suggesting a role in regulating rapid tissue development during the early life of calves. The expression of miR-146, miR-191, miR-33, miR-7, miR-99/100, miR-486, miR-145, miR-196 and miR-211 displayed significant temporal differences (FDR <0.05), while miR-192/215, miR-194, miR-196, miR-205 and miR-31 revealed significant regional differences (FDR <0.05). The expression levels of miR-15/16, miR-29 and miR-196 were positively correlated with the copy numbers of 16S rRNA gene of Bifidobacterium or Lactobacillus species or both (P<0.05). Functional analysis using Ingenuity Pathway Analysis identified the above mentioned differentially expressed miRNAs as potential regulators of gut tissue cell proliferation and differentiation. The bacterial density-associated miRNAs were identified as modulators of the development of lymphoid tissues (miR-196), maturation of dendritic cells (miR-29) and development of immune cells (miR-15/16). The present study revealed temporal and regional changes in miRNA expression and a correlation between miRNA expression and microbial population in the GIT during the early life, which provides further evidence for another mechanism by which host-microbial interactions play a role in regulating gut development. PMID 24682221
Journal.pone.0092592.g001.jpg
File history
Yi efo/eka'e gwa ebo wo le nyangagi wuncin ye kamina wunga tinya nan
| Gwalagizhi | Nyangagi | Dimensions | User | Comment | |
|---|---|---|---|---|---|
| current | 07:05, 2 April 2014 | | 815 × 800 (93 KB) | Z8600021 (talk | contribs) | Overview of miRNAs detected in the GIT of dairy calves during early life using miRNA sequencing. (A). Numbers of known (solid line) and novel miRNAs (dotted line) identified (total reads number for each tissue >20, blue line). (B). Comparison of the n... |
You cannot overwrite this file.
File usage
The following page uses this file: