File:Abnormal81-92-heart.png
Abnormal81-92-heart.png (481 × 344 pixels, file size: 6 KB, MIME type: image/png)
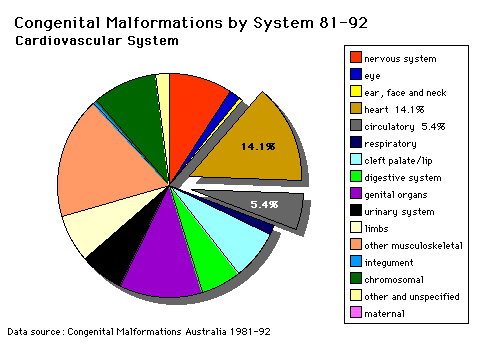
Pie diagram shows the percentage of neural defects of all notifiable birth defects in Australia.
Data groupings and classification as Major or Minor Abnormalities are based on that used by the Australian Institute of Health and Welfare National Perinatal Statistics Unit, UNSW and published in Congenital Malformations Australia 1981-92.
For individual systems, data shown as a % of all Major Abnormalities based upon published statistics using the same groupings as CMA 81-92. Please note that some congenital diseases involve more than one system.
Reference: Original Data source for graphs from Congenital Malformations Australia 1981-1992, P. Lancaster and E. Pedisich, ISSN 1321-8352.
Image Source: UNSW Embryology
File history
Yi efo/eka'e gwa ebo wo le nyangagi wuncin ye kamina wunga tinya nan
| Gwalagizhi | Nyangagi | Dimensions | User | Comment | |
|---|---|---|---|---|---|
| current | 13:32, 11 October 2009 | | 481 × 344 (6 KB) | S8600021 (talk | contribs) | Pie diagram shows the percentage of neural defects of all notifiable birth defects in Australia. Data groupings and classification as Major or Minor Abnormalities are based on that used by the Australian Institute of Health and Welfare National Perinatal |
You cannot overwrite this file.
File usage
The following 10 pages use this file:
- 2009 Lecture 21
- 2010 Lecture 21
- Australian Statistics
- Cardiovascular System - Abnormalities
- Cardiovascular System - Atrial Septal Defects
- Cardiovascular System - Hypoplastic Left Heart
- Cardiovascular System - Patent Ductus Arteriosus
- Cardiovascular System - Transposition of the Great Vessels
- Cardiovascular System - Tricuspid Atresia
- Cardiovascular System - Ventricular Septal Defects


