File:Bovine GIT miRNA expression 01.jpg
From Embryology
Size of this preview: 611 × 600 pixels. Other resolution: 815 × 800 pixels.
Original file (815 × 800 pixels, file size: 93 KB, MIME type: image/jpeg)
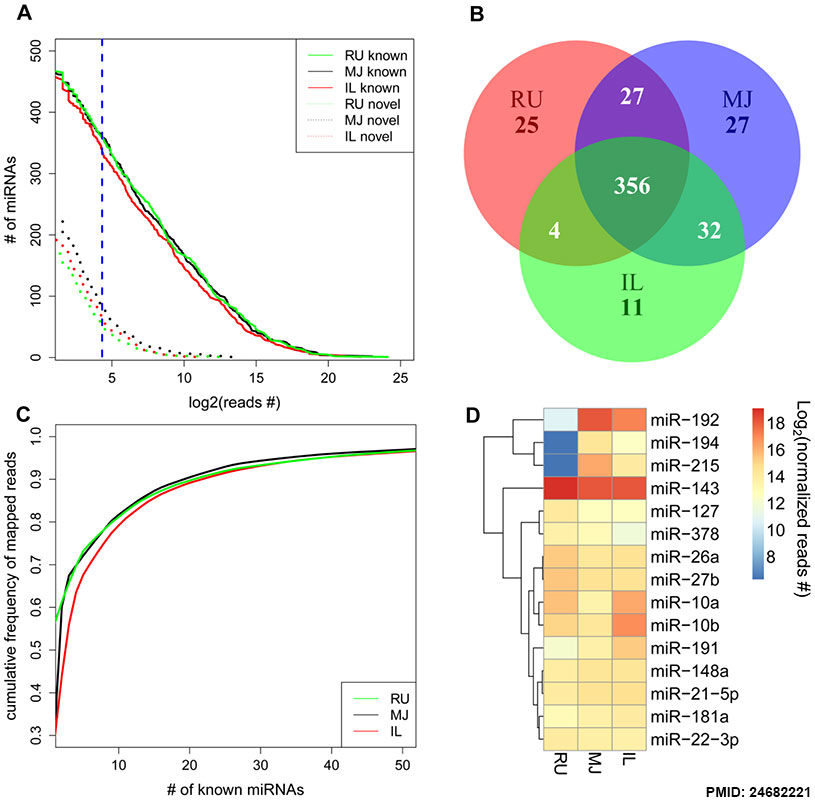
Overview of miRNAs detected in the GIT of dairy calves during early life using miRNA sequencing
- A - Numbers of known (solid line) and novel miRNAs (dotted line) identified (total reads number for each tissue >20, blue line).
- B - Comparison of the number of known miRNAs detected in rumen (RU), mid-jejunum (MJ), and ileum (IL). (
- C - Cumulative frequency of known miRNAs detected in rumen (RU), mid-jejunum (MJ), and ileum (IL).
- D - Comparative expression of top 10 highly expressed miRNAs in rumen (RU), mid-jejunum (MJ), and ileum (IL) using Heatmap.2 function in R package. Colors represent different normalised sequencing reads number as indicated by the color bar.
Reference
<pubmed>24682221</pubmed>| PLoS One.
Copyright
© 2014 Liang et al. This is an open-access article distributed under the terms of the Creative Commons Attribution License, which permits unrestricted use, distribution, and reproduction in any medium, provided the original author and source are credited.
Figure 1. doi:10.1371/journal.pone.0092592.g001 Journal.pone.0092592.g001.jpg
File history
Yi efo/eka'e gwa ebo wo le nyangagi wuncin ye kamina wunga tinya nan
| Gwalagizhi | Nyangagi | Dimensions | User | Comment | |
|---|---|---|---|---|---|
| current | 07:05, 2 April 2014 | | 815 × 800 (93 KB) | Z8600021 (talk | contribs) | Overview of miRNAs detected in the GIT of dairy calves during early life using miRNA sequencing. (A). Numbers of known (solid line) and novel miRNAs (dotted line) identified (total reads number for each tissue >20, blue line). (B). Comparison of the n... |
You cannot overwrite this file.
File usage
The following page uses this file: