File:Menstrual cycle- brain change measurements.jpg
Original file (547 × 893 pixels, file size: 88 KB, MIME type: image/jpeg)
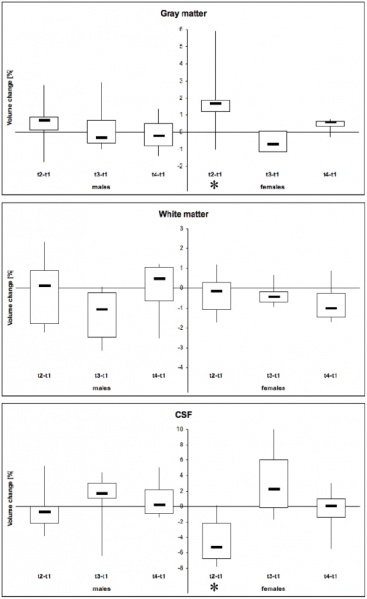
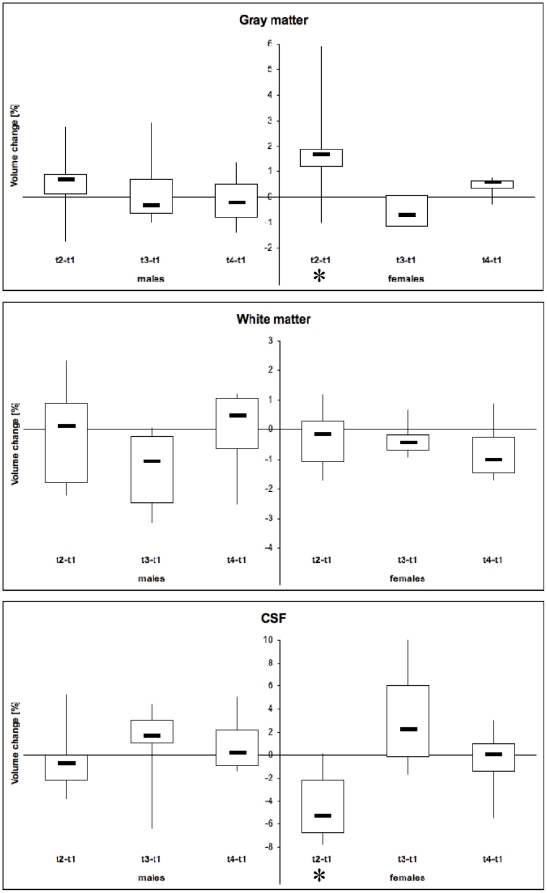
Relative volume change of grey and white matter and CSF
Between 4 time points during the menstrual cycle in women and in men, respectively
In females (right columns), there is a significant increase in grey matter at the time of ovulation and a corresponding loss of CSF compared to men (p<0.05, asterix). t1: Menses, t2: ovulation; t3 midluteal phase; t4: next menses. The data are displayed as boxplot, where 50 % of data are in the box and whiskers depict range of data. Note: different scale of y-axes.
Original file name: Figure 2 Pone.0014655.g002.jpg
Reference
From:PLoS One. 2011; 6(2): e14655. Published online 2011 February 4. doi: 10.1371/journal.pone.0014655.
Copyright Hagemann et al. This is an open-access article distributed under the terms of the Creative Commons Attribution License, which permits unrestricted use, distribution, and reproduction in any medium, provided the original author and source are credited.
File history
Yi efo/eka'e gwa ebo wo le nyangagi wuncin ye kamina wunga tinya nan
| Gwalagizhi | Nyangagi | Dimensions | User | Comment | |
|---|---|---|---|---|---|
| current | 08:53, 17 February 2011 | | 547 × 893 (88 KB) | S8600021 (talk | contribs) | ==Relative volume change of grey and white matter and CSF== Between 4 time points during the menstrual cycle in women and in men, respectively In females (right columns), there is a significant increase in grey matter at the time of ovulation and a corr |
You cannot overwrite this file.
File usage
The following page uses this file: