File:Schematic ECG normal and inverted T-wave.jpg: Difference between revisions
No edit summary |
|||
| Line 2: | Line 2: | ||
A student drawn schematic of an Electrocardiogram (ECG) with a normal ECG on the left and an ECG showing T-wave inversion on the right. T-waves represents the recovery/repolarisation of the ventricles. Inversion of T-waves relate to repolarisation abnormalities which may indicate a problem with the ventricles (in the recovery beat). | A student drawn schematic of an Electrocardiogram (ECG) with a normal ECG on the left and an ECG showing T-wave inversion on the right. T-waves represents the recovery/repolarisation of the ventricles. Inversion of T-waves relate to repolarisation abnormalities which may indicate a problem with the ventricles (in the recovery beat). | ||
===Reference=== | ===Reference=== | ||
Based off the image taken from here: http://en.wikipedia.org/wiki/File:SinusRhythmLabels.svg | Based off the image taken from here: http://en.wikipedia.org/wiki/File:SinusRhythmLabels.svg | ||
===Assessment=== | |||
+ Relevant clinical image to group project. | |||
+ Includes reference, copyright and student disclaimer. | |||
+ Legend includes description of image meets peer teaching criteria. | |||
+ Responded to reviewer comment [[User:S8600021|Mark Hill]] 15:07, 20 September 2011 (EST) Yes, but why is it inverted? Perhaps a little more explanation here. | |||
{{Template:2011 Student Image}} | {{Template:2011 Student Image}} | ||
Revision as of 13:39, 29 October 2011
Schematic ECG Normal and Inverted T-wave
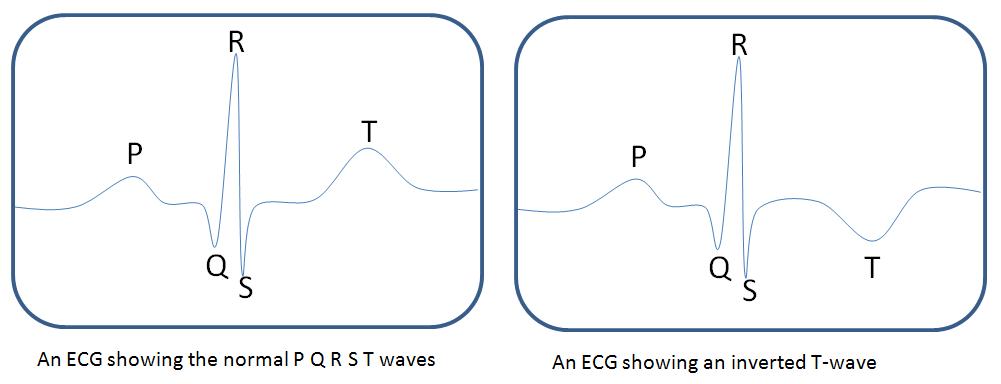
A student drawn schematic of an Electrocardiogram (ECG) with a normal ECG on the left and an ECG showing T-wave inversion on the right. T-waves represents the recovery/repolarisation of the ventricles. Inversion of T-waves relate to repolarisation abnormalities which may indicate a problem with the ventricles (in the recovery beat).
Reference
Based off the image taken from here: http://en.wikipedia.org/wiki/File:SinusRhythmLabels.svg
Assessment
+ Relevant clinical image to group project. + Includes reference, copyright and student disclaimer. + Legend includes description of image meets peer teaching criteria. + Responded to reviewer comment Mark Hill 15:07, 20 September 2011 (EST) Yes, but why is it inverted? Perhaps a little more explanation here.
- Note - This image was originally uploaded as part of a student project and may contain inaccuracies in either description or acknowledgements. Students have been advised in writing concerning the reuse of content and may accidentally have misunderstood the original terms of use. If image reuse on this non-commercial educational site infringes your existing copyright, please contact the site editor for immediate removal.
Cite this page: Hill, M.A. (2024, June 25) Embryology Schematic ECG normal and inverted T-wave.jpg. Retrieved from https://embryology.med.unsw.edu.au/embryology/index.php/File:Schematic_ECG_normal_and_inverted_T-wave.jpg
- © Dr Mark Hill 2024, UNSW Embryology ISBN: 978 0 7334 2609 4 - UNSW CRICOS Provider Code No. 00098G
File history
Yi efo/eka'e gwa ebo wo le nyangagi wuncin ye kamina wunga tinya nan
| Gwalagizhi | Nyangagi | Dimensions | User | Comment | |
|---|---|---|---|---|---|
| current | 22:44, 16 September 2011 | 1,001 × 384 (32 KB) | Z3329495 (talk | contribs) | A student drawn schematic of an Electrocardiogram (ECG) with a normal ECG on the left and an ECG showing T-wave inversion on the right. Based off the image taken from here: http://en.wikipedia.org/wiki/File:SinusRhythmLabels.svg {{Template:2011 Student |
You cannot overwrite this file.
File usage
The following 3 pages use this file: