File:Human uterus contractile activity.jpg: Difference between revisions
mNo edit summary |
|||
| (2 intermediate revisions by the same user not shown) | |||
| Line 3: | Line 3: | ||
Graphical presentation of synchronization of contractions of normal (panel A) and fibromyomatous (panel B) uterus. | Graphical presentation of synchronization of contractions of normal (panel A) and fibromyomatous (panel B) uterus. | ||
* '''A''' - the maximal values of the cross-correlation coefficients are mainly located in the area of the positive time lags. In this area there are 99.70 per cent points of the instantaneous time shift curve. So, the propagation% parameter equals 99.70. In this case, the fundal time series mostly runs ahead of the cervical one. | |||
* '''B''' - the maximal values of the cross-correlation coefficients are located in the areas of the positive and negative time lags. In the area of the positive time lags are located 61.08 per cent points of the instantaneous time shift curve. In this case we have disturbed synchronization. | |||
{| | |||
! Panel A Synchronization of the recording for the normal uterine activity | |||
(a) Uterine contractions (standardized signals) | ! Panel B Synchronization for the uterine activity in patients with fibromyomas | ||
|- | |||
| (a) Uterine contractions (standardized signals) | |||
(b) Running cross-correlation functions (values of the cross-correlation coefficients correspond to the gray levels) | (b) Running cross-correlation functions (values of the cross-correlation coefficients correspond to the gray levels) | ||
(c) Instantaneous time shift shows the maximal values of the cross-correlation coefficients for fixed time | (c) Instantaneous time shift shows the maximal values of the cross-correlation coefficients for fixed time | ||
|(a) Uterine contractions | |||
(a) Uterine contractions | |||
(b) Running cross-correlation functions | (b) Running cross-correlation functions | ||
(c) Instantaneous time shift. | (c) Instantaneous time shift. | ||
|} | |||
:'''Links:''' [[Birth]] | [[Uterus Development]] | |||
===Reference=== | ===Reference=== | ||
| Line 32: | Line 32: | ||
Pierzynski et al. BMC Pregnancy and Childbirth 2007 7(Suppl 1):S6 doi:10.1186/1471-2393-7-S1-S6 | Pierzynski et al. BMC Pregnancy and Childbirth 2007 7(Suppl 1):S6 doi:10.1186/1471-2393-7-S1-S6 | ||
Original file name: Figure 1. 1471-2393-7-S1-S6-1-l.jpg http://www.biomedcentral.com/1471-2393/7/S1/S6/figure/F1 | |||
{{Footer}} | {{Footer}} | ||
[[Category:Human]] [[Category:Uterus]] [[Category:Birth]] | [[Category:Human]] [[Category:Uterus]] [[Category:Birth]] | ||
Latest revision as of 18:57, 27 October 2015
Uterus Contractile Activity
Graphical presentation of synchronization of contractions of normal (panel A) and fibromyomatous (panel B) uterus.
- A - the maximal values of the cross-correlation coefficients are mainly located in the area of the positive time lags. In this area there are 99.70 per cent points of the instantaneous time shift curve. So, the propagation% parameter equals 99.70. In this case, the fundal time series mostly runs ahead of the cervical one.
- B - the maximal values of the cross-correlation coefficients are located in the areas of the positive and negative time lags. In the area of the positive time lags are located 61.08 per cent points of the instantaneous time shift curve. In this case we have disturbed synchronization.
| Panel A Synchronization of the recording for the normal uterine activity | Panel B Synchronization for the uterine activity in patients with fibromyomas |
|---|---|
| (a) Uterine contractions (standardized signals)
(b) Running cross-correlation functions (values of the cross-correlation coefficients correspond to the gray levels) (c) Instantaneous time shift shows the maximal values of the cross-correlation coefficients for fixed time |
(a) Uterine contractions
(b) Running cross-correlation functions (c) Instantaneous time shift. |
- Links: Birth | Uterus Development
Reference
<pubmed>17570166</pubmed>| BMC Pregnancy Childbirth.
Copyright
© 2007 Pierzynski et al; licensee BioMed Central Ltd. This is an open access article distributed under the terms of the Creative Commons Attribution License (http://creativecommons.org/licenses/by/2.0), which permits unrestricted use, distribution, and reproduction in any medium, provided the original work is properly cited.
Pierzynski et al. BMC Pregnancy and Childbirth 2007 7(Suppl 1):S6 doi:10.1186/1471-2393-7-S1-S6 Original file name: Figure 1. 1471-2393-7-S1-S6-1-l.jpg http://www.biomedcentral.com/1471-2393/7/S1/S6/figure/F1
Cite this page: Hill, M.A. (2024, June 21) Embryology Human uterus contractile activity.jpg. Retrieved from https://embryology.med.unsw.edu.au/embryology/index.php/File:Human_uterus_contractile_activity.jpg
- © Dr Mark Hill 2024, UNSW Embryology ISBN: 978 0 7334 2609 4 - UNSW CRICOS Provider Code No. 00098G
File history
Yi efo/eka'e gwa ebo wo le nyangagi wuncin ye kamina wunga tinya nan
| Gwalagizhi | Nyangagi | Dimensions | User | Comment | |
|---|---|---|---|---|---|
| current | 12:06, 1 November 2010 | 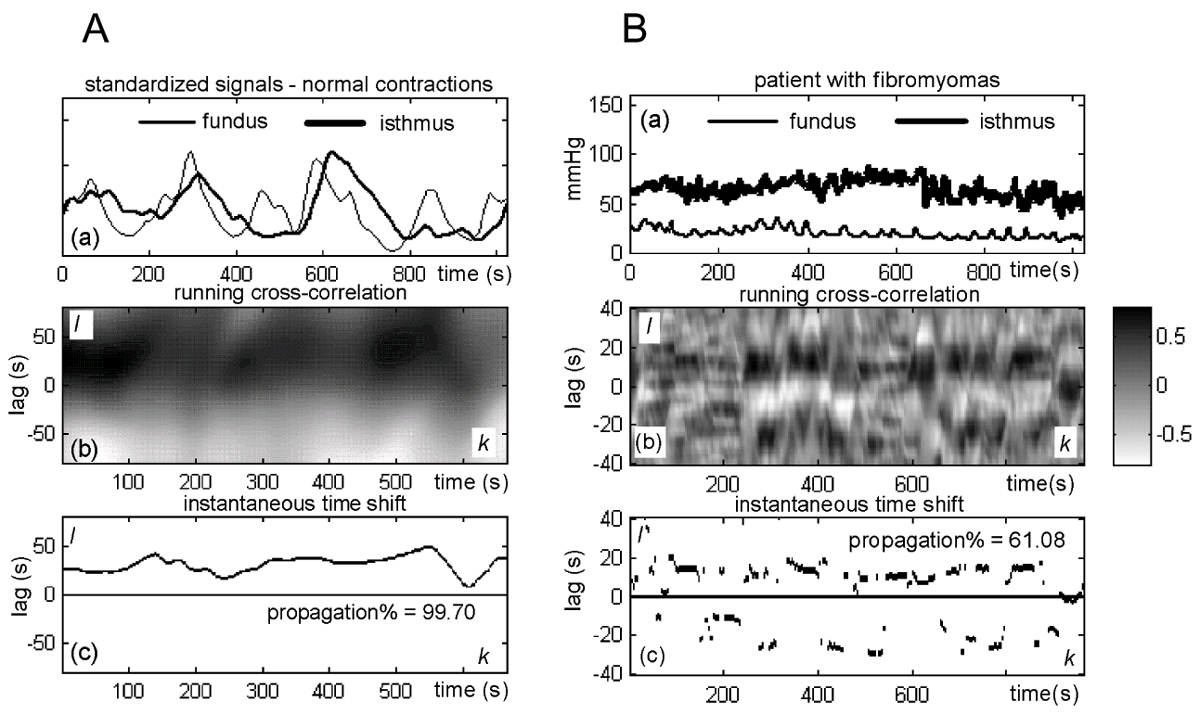 | 1,200 × 714 (318 KB) | S8600021 (talk | contribs) | ==Uterus Contractile Activity== Graphical presentation of synchronization of contractions of normal (panel A) and fibromyomatous (panel B) uterus. In panel A, the maximal values of the cross-correlation coefficients are mainly located in the area of th |
You cannot overwrite this file.
File usage
The following page uses this file: