ILP2006 - Carnegie stage Animations
Introduction

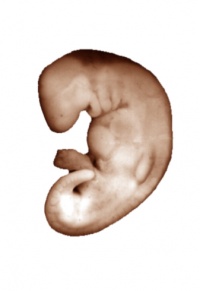
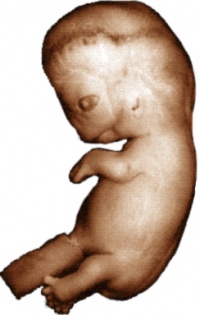
The following pages contain 3D reconstructions of embryos, constructed from the serial slices available here. Two embryos have been imaged: a Carnegie stage 13/14 pig embryo, and a Carnegie stage 22 human embryo. The surface of the embryos has been rendered transparent, allowing the internal structures to be clearly visualized. The colour-scheme of the structures corresponds to the various systems in the embryo. Subsequent pages show the embryos with these systems isolated and differentiated into separate components.
- Links: Movies - stage 13 | Movies - stage 22 | Embryology ILPs
To view models of either of the two embryos, click on the image below
|
|
The Making of the Models
Please note that the images shown below have been simplified and the number of slices shown in each has been dramatically decreased for ease of understanding. (More? Artistic Licence)
Stage 1: Sectioning the embryo

As stated, the models were generated using the serial slices available here. The serial slices were produced by sectioning the embryo into separate slices and subsequently mounting each slice for viewing under a high power microscope. These were then scanned and digitally edited to remove any distortion or artifacts that may have been generated. The adjacent image shows sectioning of the pig embryo. An unavoidable result of the sectioning is that some data from the top and bottom of the embryo can not be captured. For this reason, the final models are missing data in the head and rump region, giving them a "box-like" shape.
Stage 2: Tracing the structures
Production of the models required the use of software that was capable of converting the sectioned histological data into 3D coordinates. After thorough testing, the software package "Winsurf" or "SurfDriver" was selected. The scanned histological slices were loaded into Winsurf. Sequential data points were traced around each structure, through every slice that it was visible in. The image below shows the tracing of the epidermis of the pig embyro. The green border that forms around each slice is the final series of data points that will be utilized to generate the final model.

Stage 3: Generating the surface
Once the structure has been traced in every slice it appears in, the slices needed to be aligned and spaced evenly. Winsurf then utilised the data to estimate the missing information between the slices. The position of the structure in the space between two slices was approximated based on the known coordinates from the slices themselves, and this process occured between every slice, generating a 3D representation of the original structure. In the image below we can see that process occurring for the epidermis of the pig embryo. First the slices containing the epidermis of the pig embryo are aligned and accurately spaced. Finally, we see a "skin" being added over the slices as the gaps are estimated and the final epidermis is generated.

Glossary Links
- Glossary: A | B | C | D | E | F | G | H | I | J | K | L | M | N | O | P | Q | R | S | T | U | V | W | X | Y | Z | Numbers | Symbols | Term Link
Cite this page: Hill, M.A. (2024, April 30) Embryology ILP2006 - Carnegie stage Animations. Retrieved from https://embryology.med.unsw.edu.au/embryology/index.php/ILP2006_-_Carnegie_stage_Animations
- © Dr Mark Hill 2024, UNSW Embryology ISBN: 978 0 7334 2609 4 - UNSW CRICOS Provider Code No. 00098G