File:USA live births and fertility rates.jpg: Difference between revisions
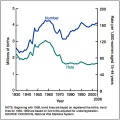
(Live births and fertility rates: United States, 1930–2006 NOTE: Beginning with 1959, trend lines are based on registered live births; trend lines for 1930–1959 are based on live births adjusted for underregistration. SOURCE: CDC/NCHS, National Vital) |
No edit summary |
||
| (One intermediate revision by the same user not shown) | |||
| Line 1: | Line 1: | ||
Live births and fertility rates: United States, 1930–2006 | Live births and fertility rates: United States, 1930–2006 | ||
{{Template:NVSR USA Births 2006}} | |||
NOTE: Beginning with 1959, trend lines are based on registered live births; trend lines for 1930–1959 are based on live births adjusted for underregistration. | NOTE: Beginning with 1959, trend lines are based on registered live births; trend lines for 1930–1959 are based on live births adjusted for underregistration. | ||
'''Fertility rate''' - The general fertility rate (GFR) was 68.5 live births per 1,000 women of childbearing age (15–44 years) in 2006, a 3percent increase from 2005 (66.7) and the highest rate reported since 1991. The GFR decreased substantially from 1990 (70.9) to 1997 (63.6) but has generally increased since. | |||
SOURCE: CDC/NCHS, National Vital Statistics System. | SOURCE: CDC/NCHS, National Vital Statistics System. | ||
Latest revision as of 08:57, 10 April 2010
Live births and fertility rates: United States, 1930–2006
Links NVSR USA Births 2006: Cesarean rate by gestational age | Live births and fertility rates | Mean age mother first birth by state | Change distribution births by gestational age | Percentage low birthweight by maternal age | Triplet birth rate | Reference | Birth | National Vital Statistics Reports
NOTE: Beginning with 1959, trend lines are based on registered live births; trend lines for 1930–1959 are based on live births adjusted for underregistration.
Fertility rate - The general fertility rate (GFR) was 68.5 live births per 1,000 women of childbearing age (15–44 years) in 2006, a 3percent increase from 2005 (66.7) and the highest rate reported since 1991. The GFR decreased substantially from 1990 (70.9) to 1997 (63.6) but has generally increased since.
SOURCE: CDC/NCHS, National Vital Statistics System.
Martin JA, Hamilton BE, Sutton PD, Ventura SJ, et al. Births: Final data for 2006. National vital statistics reports; vol 57 no 7. Hyattsville, MD: National Center for Health Statistics. 2009.
Copyright information - All material appearing in this report is in the public domain and may be reproduced or copied without permission; citation as to source, however, is appreciated
File history
Click on a date/time to view the file as it appeared at that time.
| Date/Time | Thumbnail | Dimensions | User | Comment | |
|---|---|---|---|---|---|
| current | 17:42, 9 April 2010 |  | 600 × 600 (67 KB) | S8600021 (talk | contribs) | Live births and fertility rates: United States, 1930–2006 NOTE: Beginning with 1959, trend lines are based on registered live births; trend lines for 1930–1959 are based on live births adjusted for underregistration. SOURCE: CDC/NCHS, National Vital |
You cannot overwrite this file.
File usage
The following page uses this file: