File:USA Cesarean Births 2013.jpg: Difference between revisions
From Embryology
mNo edit summary |
mNo edit summary |
||
| Line 1: | Line 1: | ||
==USA Caesarean delivery by gestational age (2009, 2012, and 2013)== | ==USA Caesarean delivery by gestational age (2009, 2012, and 2013)== | ||
* The cesarean delivery rate, which had been stable at 32.8% for 2010–2012, declined to 32.7% of all U.S. births in 2013. | |||
* Declines in cesarean deliveries were seen at 38, 40, and 41 completed weeks of gestation in 2013 from 2012. | |||
Revision as of 04:52, 21 January 2015
USA Caesarean delivery by gestational age (2009, 2012, and 2013)
- The cesarean delivery rate, which had been stable at 32.8% for 2010–2012, declined to 32.7% of all U.S. births in 2013.
- Declines in cesarean deliveries were seen at 38, 40, and 41 completed weeks of gestation in 2013 from 2012.
- Links: Caesarean Delivery | Birth | USA Statistics | Report PDF
Reference
Martin JA, Hamilton BE, Osterman MJK, et al. Births: Final data for 2013. National vital statistics reports; vol 64 no 1. Hyattsville, MD: National Center for Health Statistics. 2015. http://www.cdc.gov/nchs/data/nvsr/nvsr64/nvsr64_01.pdf
Copyright
All material appearing in this report is in the public domain and may be reproduced or copied without permission; citation as to source, however, is appreciated.
File history
Click on a date/time to view the file as it appeared at that time.
| Date/Time | Thumbnail | Dimensions | User | Comment | |
|---|---|---|---|---|---|
| current | 04:43, 21 January 2015 | 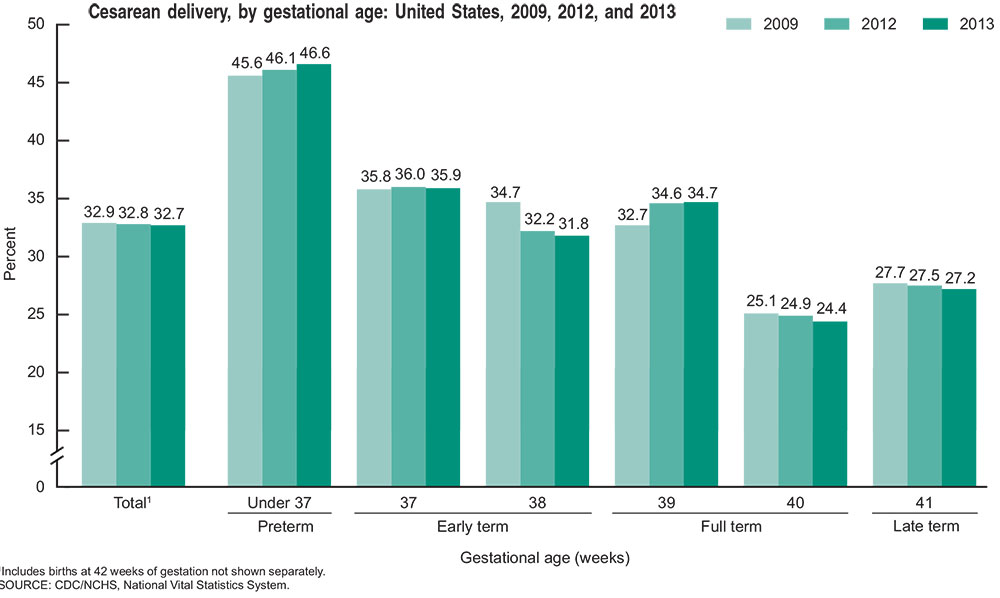 | 1,000 × 598 (64 KB) | Z8600021 (talk | contribs) | ==USA Caesarean delivery by gestational age (2009, 2012, and 2013)== :Links: Caesarean Delivery | Birth | USA Statistics ===Reference=== Martin JA, Hamilton BE, Osterman MJK, et al. Births: Final data for 2013... |
You cannot overwrite this file.
File usage
The following 2 pages use this file: