File:The frequency of SD cells for RB1 and SNRPN in WS and control individuals.jpg
Original file (600 × 769 pixels, file size: 97 KB, MIME type: image/jpeg)
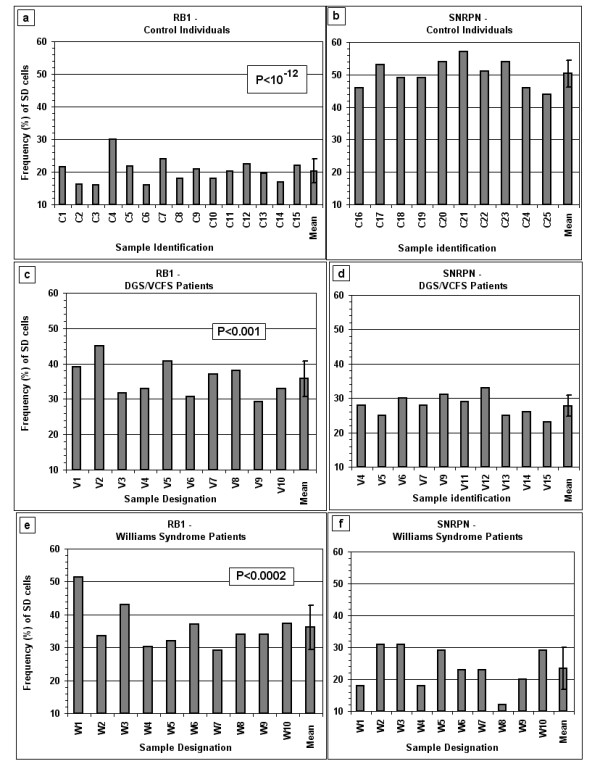
The frequency of SD cells for RB1 and SNRPN. (a) and (b), samples from control individuals; (c) and (d), samples from patients with DGS/VCFS; and (e) and (f), samples from patients with Williams syndrome. The P values in frames (a), (c) and (e) represent the level of significance of the differences in the frequency of SD cells between RB1 and SNRPN within a given group of samples. The mean frequency and standard deviation for each locus in each group of samples are also shown (last bar in each frame). http://www.ncbi.nlm.nih.gov/pmc/articles/PMC2660353/
Reference
<pubmed>19284877</pubmed>
PMID 19284877
This is an Open Access article distributed under the terms of the Creative Commons Attribution License (http://creativecommons.org/licenses/by/2.0), which permits unrestricted use, distribution, and reproduction in any medium, provided the original work is properly cited.
File history
Click on a date/time to view the file as it appeared at that time.
| Date/Time | Thumbnail | Dimensions | User | Comment | |
|---|---|---|---|---|---|
| current | 23:12, 16 August 2011 | | 600 × 769 (97 KB) | Z3332178 (talk | contribs) | The frequency of SD cells for RB1 and SNRPN. (a) and (b), samples from control individuals; (c) and (d), samples from patients with DGS/VCFS; and (e) and (f), samples from patients with Williams syndrome. The P values in frames (a), (c) and (e) represent |
You cannot overwrite this file.
File usage
The following file is a duplicate of this file (more details):
The following 2 pages use this file: