File:Postnatal free T4 levels graph.jpg
Original file (819 × 628 pixels, file size: 33 KB, MIME type: image/jpeg)
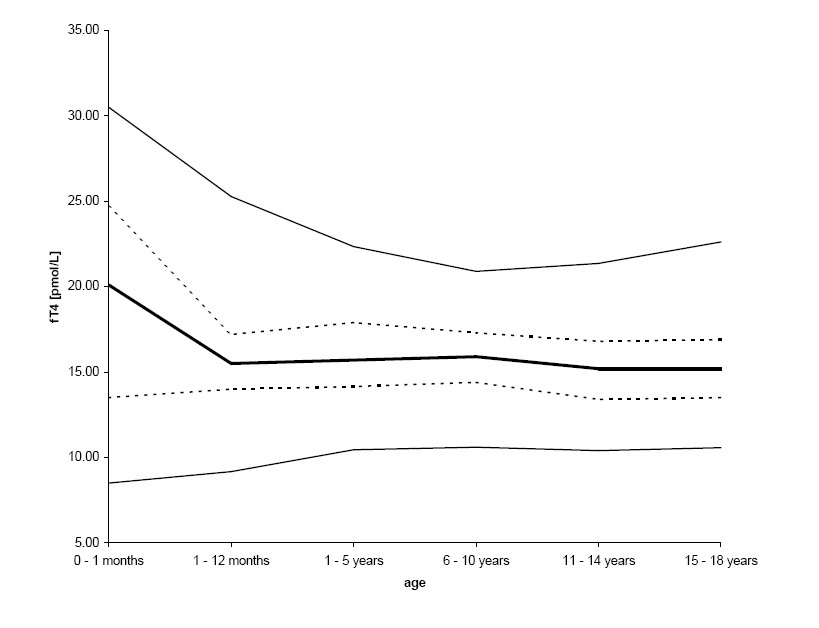
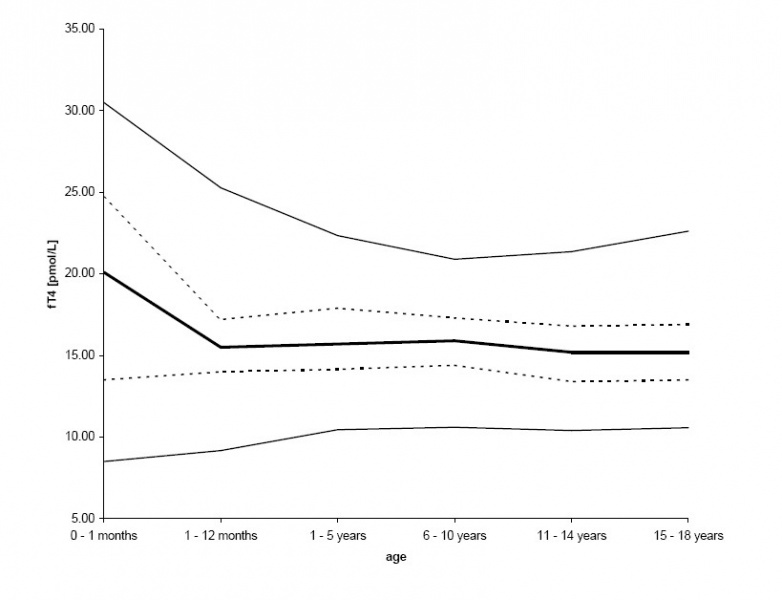
Postnatal free T4 Graph
Age-related reference values for fT4 (both sexes). The central 95% range (2.5th, 25th, 50th, 75th, and 97.5th percentiles) is shown. Due to resolution reasons lines start at zero, although no samples were taken within the first hours after birth.
Reference
<pubmed>219036169</pubmed>| BMC Endocr Disord.
Copyright
© 2013 Breitfeld et al.; licensee BioMed Central Ltd. This is an open access article distributed under the terms of the Creative Commons Attribution License (http://creativecommons.org/licenses/by/2.0), which permits unrestricted use, distribution, and reproduction in any medium, provided the original work is properly cited.
Figure 4. 1472-6823-8-15-4-l.jpg
File history
Click on a date/time to view the file as it appeared at that time.
| Date/Time | Thumbnail | Dimensions | User | Comment | |
|---|---|---|---|---|---|
| current | 20:09, 26 May 2014 | | 819 × 628 (33 KB) | Z8600021 (talk | contribs) | ==Postnatal free T4 Graph== Age-related reference values for fT4 (both sexes). The central 95% range (2.5th, 25th, 50th, 75th, and 97.5th percentiles) is shown. Due to resolution reasons lines start at zero, although no samples were taken within the f... |
You cannot overwrite this file.
File usage
The following page uses this file: