File:Mouse thymus development 02.jpg
Mouse_thymus_development_02.jpg (600 × 445 pixels, file size: 50 KB, MIME type: image/jpeg)
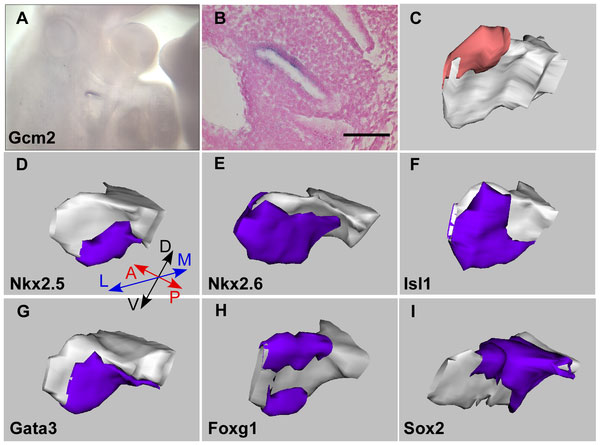
Expression of Transcription Factors in the pharyngeal region at E10.5
3D reconstructions of the 3rd pouch reveal differentially regionalized expression patterns of Nkx2-5, Nkx2-6, Isl1, Gata3, Foxg1 and Sox2 at E10.5 days.
(A–C) Expression pattern of Gcm2 in the third pouch at E 10.5.
Whole mount (A) and parasagittal sections (B) of E10.5 embryos hybridized with a Gcm2 probe.
(C) A left third pouch was reconstructed showing Gcm2 expression in red.
(D–I) 3D reconstructions of the left 3rd pouch showing the expression of each gene in blue. Orientation of the reconstructed pouch is shown in (D).
D, dorsal; V, ventral; A, anterior; P, posterior; L, lateral; M, medial. Scale bar represents 100 µm.
Reference
<pubmed>22087235</pubmed>| PLoS One.
© 2011 Wei, Condie. This is an open-access article distributed under the terms of the Creative Commons Attribution License, which permits unrestricted use, distribution, and reproduction in any medium, provided the original author and source are credited.
Original file name: Figure 3. Journal.pone.0026795.g003.png
doi:10.1371/journal.pone.0026795.g003
Mouse thymus development 01.jpg
File history
Click on a date/time to view the file as it appeared at that time.
| Date/Time | Thumbnail | Dimensions | User | Comment | |
|---|---|---|---|---|---|
| current | 13:18, 20 February 2012 | | 600 × 445 (50 KB) | S8600021 (talk | contribs) | ==Expression of Transcription Factors in the pharyngeal region at E10.5== 3D reconstructions of the 3rd pouch reveal differentially regionalized expression patterns of Nkx2-5, Nkx2-6, Isl1, Gata3, Foxg1 and Sox2 at E10.5 days. (A–C) Expression pattern |
You cannot overwrite this file.
File usage
The following page uses this file: