File:Male puberty testicular volume graph.jpg
Original file (1,140 × 826 pixels, file size: 126 KB, MIME type: image/jpeg)
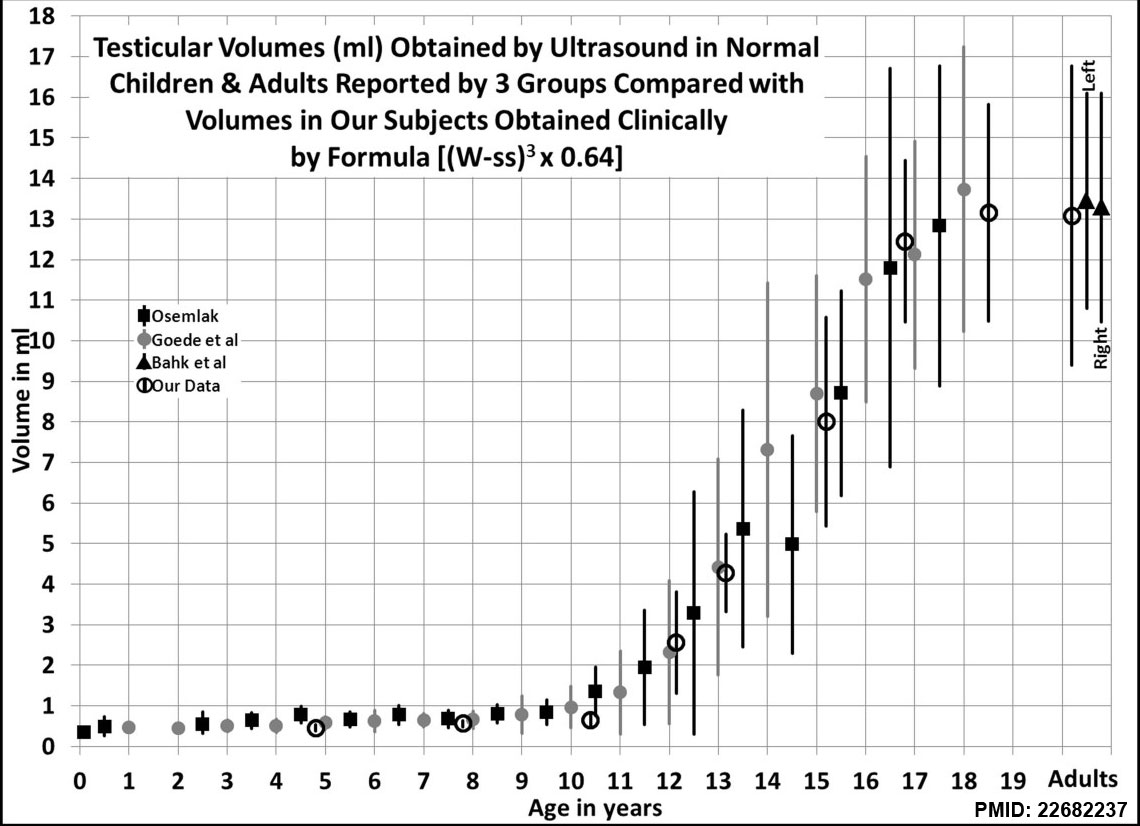
Male Puberty - Testicular Volume Graph
Testicular Volumes at gonadal stages with 3 formulas, chart Illustration of the means ± SD of volumes at different stages of gonadal (G) development. The formula with the constant 0.64 is equivalent to the equation W x H x L x 0.52; the one with the constant 0.80 is equivalent to W2 x L x 0.52; the one with the constant 0.88 is equivalent to W x H x L x 0.71”.
- Links: Puberty
Reference
PMID 22682237
http://www.ijpeonline.com/content/2012/1/17
Copyright
© 2012 Sotos and Tokar.; licensee BioMed Central Ltd. This is an Open Access article distributed under the terms of the Creative Commons Attribution License ( http://creativecommons.org/licenses/by/2.0), which permits unrestricted use, distribution, and reproduction in any medium, provided the original work is properly cited.
Sotos and Tokar International Journal of Pediatric Endocrinology 2012 2012:17 doi:10.1186/1687-9856-2012-17
File history
Click on a date/time to view the file as it appeared at that time.
| Date/Time | Thumbnail | Dimensions | User | Comment | |
|---|---|---|---|---|---|
| current | 12:44, 2 June 2015 | | 1,140 × 826 (126 KB) | Z8600021 (talk | contribs) | |
| 11:51, 2 June 2015 | 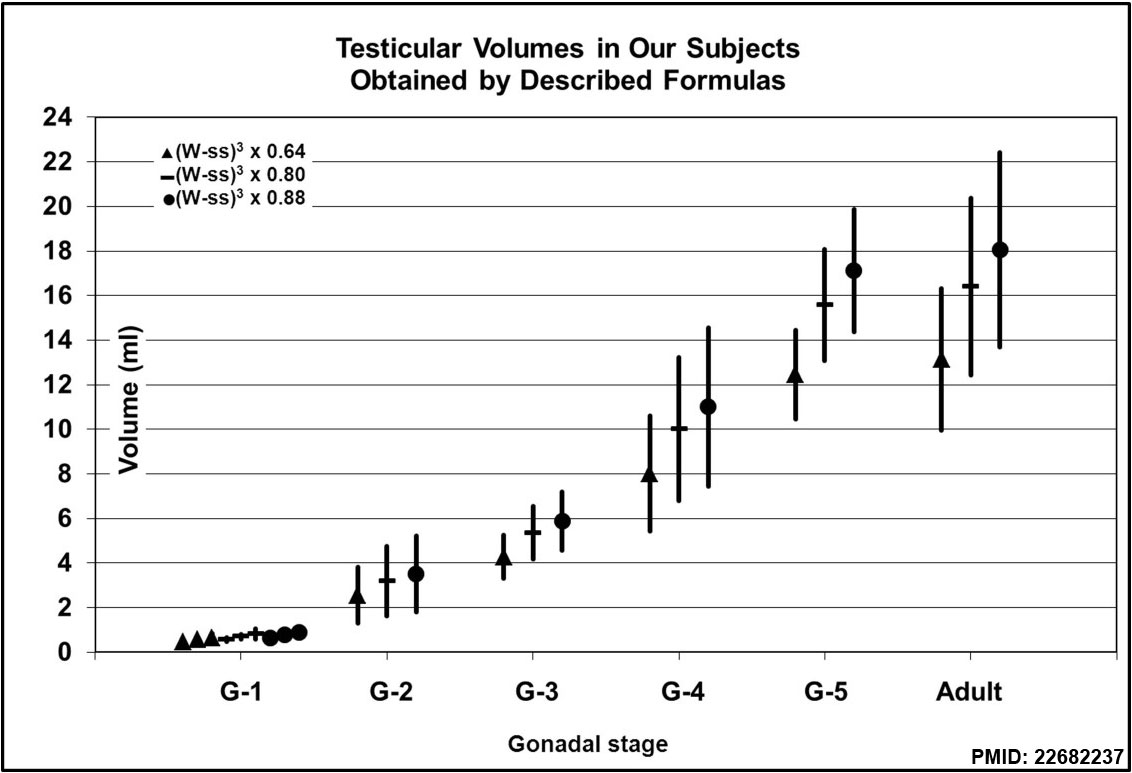 | 1,132 × 773 (78 KB) | Z8600021 (talk | contribs) | ==Male puberty testicular volume graph== ===Reference=== PMID 22682237 http://www.ijpeonline.com/content/2012/1/17 ====Copyright==== © 2012 Sotos and Tokar.; licensee BioMed Central Ltd. This is an Open Access article distributed under the terms... |
You cannot overwrite this file.
File usage
The following 3 pages use this file: