File:Frog ectoderm gene co-expression network.jpg

Original file (3,637 × 3,264 pixels, file size: 2.11 MB, MIME type: image/jpeg)
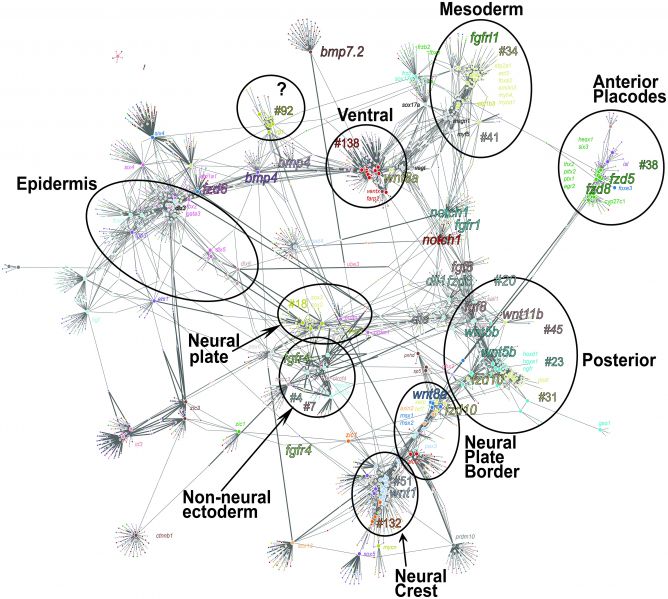
Gene co-expression network of Xenopus neurula
Visualized biologically meaningful relationships between weighted gene co-expression network analysis (WGCNA) groups and subsets of genes. We obtained a gene co-expression network using a large input gene list, including Wnt-related transcripts, neural, neural crest (NC), placode, and mesoderm genes as input nodes (large points, S10 Table). The p-value cutoff <1E-09 generated 2,001 nodes (small points indicate closely correlated genes; the color of the points refers to a given WGCNA group) and 4,945 edges.
Circles are drawn to groups of genes with close spatial/temporal expression patterns. The group was named based on known members of the group.
Groups are linked to other groups with positive (thin line) or negative (thick line) correlation.
As an example, NC genes (groups #51 and #132) and placodes (group #38, in green) display negative correlation of expression with posterior genes (groups #23, #20, thick lines). The network also indicates interactions between ventral genes such as ventx genes (group #138), positively correlated with bmp4 and bmp7.2 (thin lines). When running the EctoMap application, the network is interactive and indicates each gene name upon selection.
Reference
Plouhinec JL, Medina-Ruiz S, Borday C, Bernard E, Vert JP, Eisen MB, Harland RM & Monsoro-Burq AH. (2017). A molecular atlas of the developing ectoderm defines neural, neural crest, placode, and nonneural progenitor identity in vertebrates. PLoS Biol. , 15, e2004045. PMID: 29049289 DOI.
Copyright
© 2017 Plouhinec et al. This is an open access article distributed under the terms of the Creative Commons Attribution License, which permits unrestricted use, distribution, and reproduction in any medium, provided the original author and source are credited.
Fig 9. https://doi.org/10.1371/journal.pbio.2004045.g009
Cite this page: Hill, M.A. (2024, April 27) Embryology Frog ectoderm gene co-expression network.jpg. Retrieved from https://embryology.med.unsw.edu.au/embryology/index.php/File:Frog_ectoderm_gene_co-expression_network.jpg
- © Dr Mark Hill 2024, UNSW Embryology ISBN: 978 0 7334 2609 4 - UNSW CRICOS Provider Code No. 00098G
File history
Click on a date/time to view the file as it appeared at that time.
| Date/Time | Thumbnail | Dimensions | User | Comment | |
|---|---|---|---|---|---|
| current | 19:03, 11 May 2019 | | 3,637 × 3,264 (2.11 MB) | Z8600021 (talk | contribs) | Fig 9. Gene co-expression network of Xenopus neurula visualized biologically meaningful relationships between weighted gene co-expression network analysis (WGCNA) groups and subsets of genes. We obtained a gene co-expression network using a large input... |
You cannot overwrite this file.
File usage
The following page uses this file: