File:Computed tomography effective doses.jpg
Computed_tomography_effective_doses.jpg (600 × 441 pixels, file size: 32 KB, MIME type: image/jpeg)
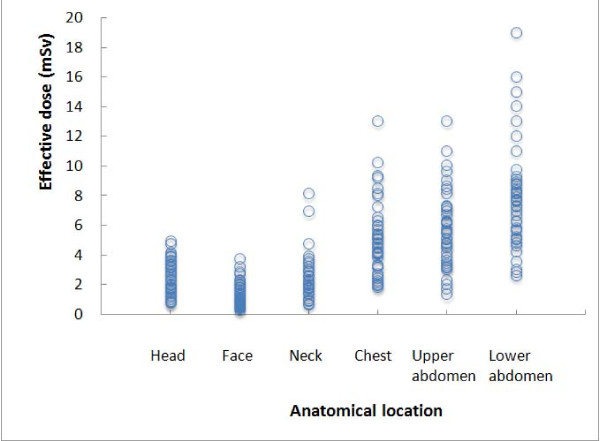
Computed Tomography Effective Doses (Japan)
Distribution of effective dose for one scan for each anatomical location in Gunma prefecture. The radiation dose of CT examinations varies greatly among institutions.
- 132 CT scanners in 126 hospitals, complete data were provided for 63 CT scanners (48%) of 57 hospitals.
- 61 hospitals reported only scanning protocols and the number of patients during the month surveyed, so scanning protocols and the number of the patients undergoing CT examinations for 124 of 132 CT scanners (94%) were obtained.
Original file name: Figure 3. 1471-2342-10-24-3.jpg
Reference
<pubmed>21044293</pubmed>| BMC Med Imaging.
© 2010 Tsushima et al; licensee BioMed Central Ltd. This is an Open Access article distributed under the terms of the Creative Commons Attribution License (http://creativecommons.org/licenses/by/2.0), which permits unrestricted use, distribution, and reproduction in any medium, provided the original work is properly cited.
File history
Click on a date/time to view the file as it appeared at that time.
| Date/Time | Thumbnail | Dimensions | User | Comment | |
|---|---|---|---|---|---|
| current | 10:48, 21 December 2010 |  | 600 × 441 (32 KB) | S8600021 (talk | contribs) | ==Computed Tomography Effective Doses (Japan)== Distribution of effective dose for one scan for each anatomical location in Gunma prefecture. The radiation dose of CT examinations varies greatly among institutions. * 132 CT scanners in 126 hospitals, com |
You cannot overwrite this file.
File usage
The following page uses this file:
