File:Bovine morula 01.jpg: Difference between revisions
No edit summary |
|||
| Line 1: | Line 1: | ||
==Bovine Morula== | ==Bovine Morula== | ||
A Arrest and death of early blastomeres during the first four cleavage cycles. Maximum intensity z-projections of optical serial sections of embryos examined at day 4. Many embryos show large early blastomeres that are arrested at interphase (asterisks) or prophase (arrow heads) or already show clear signs of cell death: DAPI staining reveals variably sized and irregularly shaped clumps of highly condensed chromatin (large arrows). Notably, frequent findings are remnants of mitotic chromosome structures (small arrows). | |||
The embryos were fixed and mounted on coverslips in such a way that the three-dimensional structure was maintained. DNA staining with DAPI is shown in white, f-actin filaments (phalloidin-TRITC) in orange. Scale bars represent 100 µm (overviews) or 10 µm (details). | The embryos were fixed and mounted on coverslips in such a way that the three-dimensional structure was maintained. DNA staining with DAPI is shown in white, f-actin filaments (phalloidin-TRITC) in orange. Scale bars represent 100 µm (overviews) or 10 µm (details). | ||
Revision as of 07:29, 9 November 2011
Bovine Morula
A Arrest and death of early blastomeres during the first four cleavage cycles. Maximum intensity z-projections of optical serial sections of embryos examined at day 4. Many embryos show large early blastomeres that are arrested at interphase (asterisks) or prophase (arrow heads) or already show clear signs of cell death: DAPI staining reveals variably sized and irregularly shaped clumps of highly condensed chromatin (large arrows). Notably, frequent findings are remnants of mitotic chromosome structures (small arrows).
The embryos were fixed and mounted on coverslips in such a way that the three-dimensional structure was maintained. DNA staining with DAPI is shown in white, f-actin filaments (phalloidin-TRITC) in orange. Scale bars represent 100 µm (overviews) or 10 µm (details).
- Links: Bovine Development
Figure 2. CLSM analysis (Panel cropped and resized from full figure)
Reference
<pubmed>21811561</pubmed>| PLoS One.
Copyright: © 2011 Leidenfrost et al. This is an open-access article distributed under the terms of the Creative Commons Attribution License, which permits unrestricted use, distribution, and reproduction in any medium, provided the original author and source are credited.
File history
Click on a date/time to view the file as it appeared at that time.
| Date/Time | Thumbnail | Dimensions | User | Comment | |
|---|---|---|---|---|---|
| current | 13:33, 4 November 2011 | 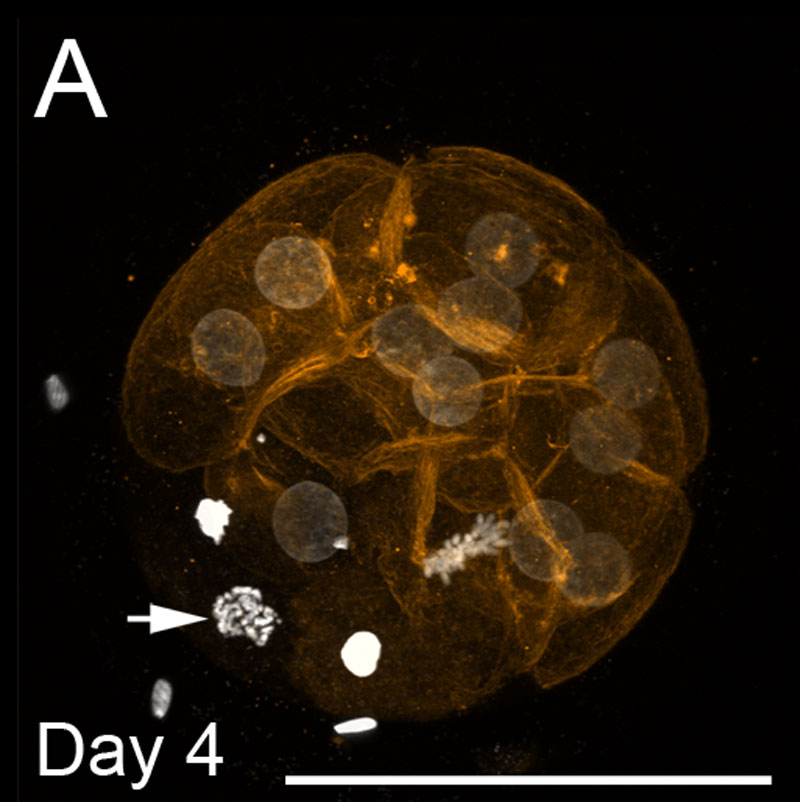 | 800 × 802 (84 KB) | S8600021 (talk | contribs) | ==Bovine Morula== A–F: Arrest and death of early blastomeres during the first four cleavage cycles. A–D: Maximum intensity z-projections of optical serial sections of embryos examined at day 4 (A, B) or day 5 (C, D). Many embryos show large early b |
You cannot overwrite this file.
File usage
The following 2 pages use this file: