File:Aus multiple birth graph.png
From Embryology
Aus_multiple_birth_graph.png (541 × 292 pixels, file size: 5 KB, MIME type: image/png)
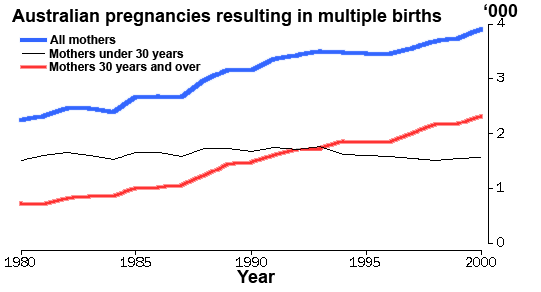
Australian pregnancies resulting in multiple births
Multiple Births
1980 - 1.0% (2,249 of 223,318; 2,219 twins, 30 triplets or higher)
1990 - 1.2% (3,168 of 259,435; 3,074 twins, 94 triplets or higher)
2000 - 1.6% (3,900 of 245,700; 3,800 twins, 100 triplets or higher)
- "Among older women this trend is more pronounced. In 1980, there were 730 confinements resulting in multiple births to women aged 30 years and over, constituting 1% of all confinements among women over 30. By 2000, this number had increased to 2,300 (2%)."
(data - Australian Bureau Statistics)
http://embryology.med.unsw.edu.au/Defect/twin.htm#AusPrevalence
File history
Click on a date/time to view the file as it appeared at that time.
| Date/Time | Thumbnail | Dimensions | User | Comment | |
|---|---|---|---|---|---|
| current | 10:54, 26 January 2010 |  | 541 × 292 (5 KB) | S8600021 (talk | contribs) | Australian pregnancies resulting in multiple births Multiple Births 1980 - 1.0% (2,249 of 223,318; 2,219 twins, 30 triplets or higher) 1990 - 1.2% (3,168 of 259,435; 3,074 twins, 94 triplets or higher) 2000 - 1.6% (3,900 of 245,700; 3,800 twins, 100 t |
You cannot overwrite this file.
