File:Postnatal thyrotropin levels graph.jpg
Original file (852 × 729 pixels, file size: 35 KB, MIME type: image/jpeg)
Postnatal Thyrotropin Graph
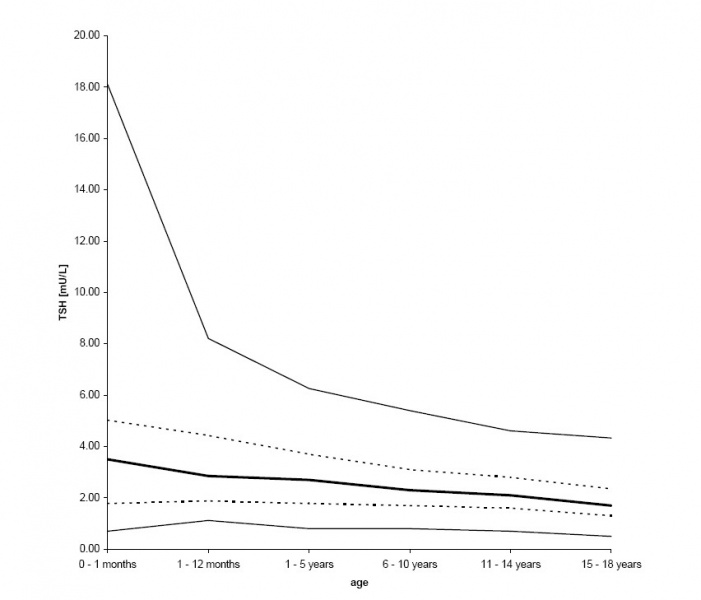
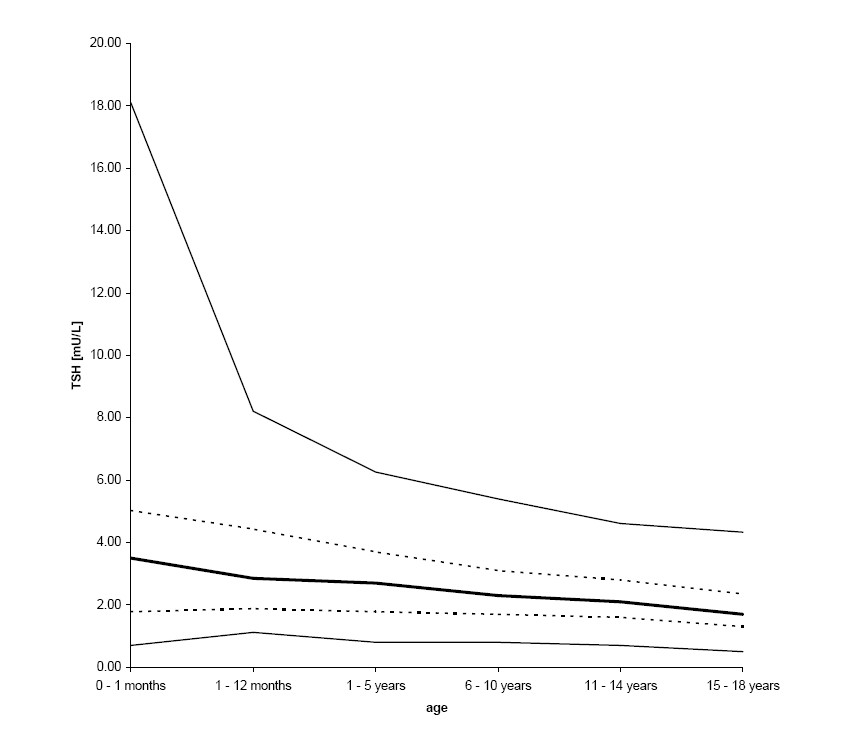
Reference intervals for thyrotropin (thyroid stimulating hormone, TSH) of age groups the central 95% range (2.5th, 25th, 50th, 75th, and 97.5th percentiles) is shown. Due to resolution reasons lines start at zero, although no samples were taken within the first hours after birth.
Reference
PubmedParser error: The PubmedParser extension received invalid XML data. ()
Copyright
© 2013 Breitfeld et al.; licensee BioMed Central Ltd. This is an open access article distributed under the terms of the Creative Commons Attribution License (http://creativecommons.org/licenses/by/2.0), which permits unrestricted use, distribution, and reproduction in any medium, provided the original work is properly cited.
Figure 1. 1472-6823-8-15-1-l.jpg
Cite this page: Hill, M.A. (2026, October 11) Embryology Postnatal thyrotropin levels graph.jpg. Retrieved from https://embryology.med.unsw.edu.au/embryology/index.php/File:Postnatal_thyrotropin_levels_graph.jpg
- © Dr Mark Hill 2026, UNSW Embryology ISBN: 978 0 7334 2609 4 - UNSW CRICOS Provider Code No. 00098G
File history
Yi efo/eka'e gwa ebo wo le nyangagi wuncin ye kamina wunga tinya nan
| Gwalagizhi | Nyangagi | Dimensions | User | Comment | |
|---|---|---|---|---|---|
| current | 20:48, 26 Mayıs 2014 | | 852 × 729 (35 KB) | Z8600021 (talk | contribs) | ==Postnatal Thyrotropin Graph== Reference intervals for thyrotropin (thyroid stimulating hormone, TSH) of age groups the central 95% range (2.5th, 25th, 50th, 75th, and 97.5th percentiles) is shown. Due to resolution reasons lines start at zero, altho... |
You cannot overwrite this file.
File usage
The following 2 pages use this file: