File:Postnatal brain graph 01.jpg
Original file (950 × 592 pixels, file size: 109 KB, MIME type: image/jpeg)
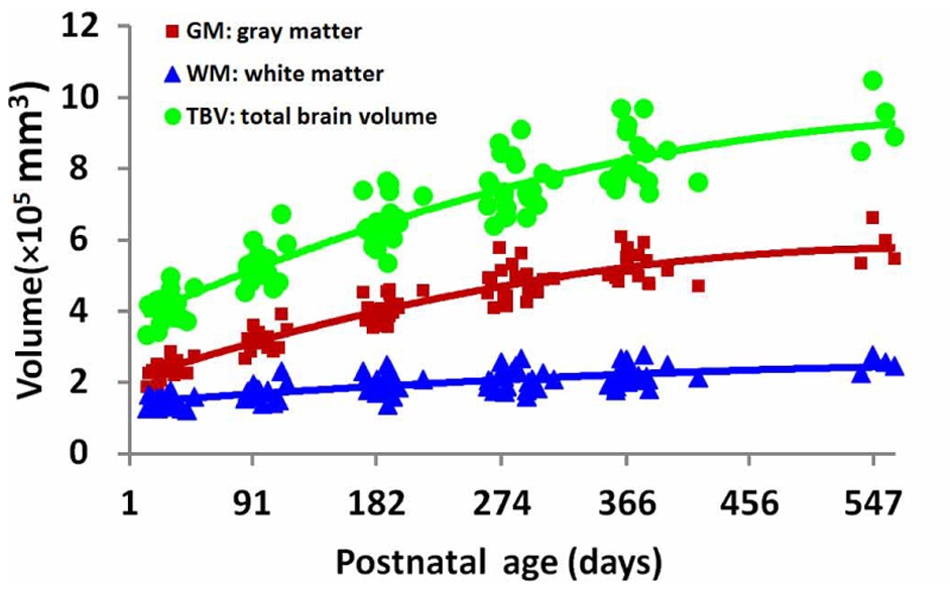
Scatterplots of TBV, cortical GM and WM volumes by age at scan.
Right: Scatterplots of cortical GM and WM volumes in terms of percentage of the total brain volume.
doi:10.1371/journal.pone.0044596.g010
Reference
Wang L, Shi F, Yap P-T, Gilmore JH, Lin W, et al. (2012) 4D Multi-Modality Tissue Segmentation of Serial Infant Images. PLoS ONE 7(9): e44596. doi:10.1371/journal.pone.0044596
Copyright: © 2012 Wang et al. This is an open-access article distributed under the terms of the Creative Commons Attribution License, which permits unrestricted use, distribution, and reproduction in any medium, provided the original author and source are credited.
File history
Yi efo/eka'e gwa ebo wo le nyangagi wuncin ye kamina wunga tinya nan
| Gwalagizhi | Nyangagi | Dimensions | User | Comment | |
|---|---|---|---|---|---|
| current | 14:18, 7 October 2012 | | 950 × 592 (109 KB) | Z8600021 (talk | contribs) | Scatterplots of TBV, cortical GM and WM volumes by age at scan. Right: Scatterplots of cortical GM and WM volumes in terms of percentage of the total brain volume. doi:10.1371/journal.pone.0044596.g010 ===Reference=== Wang L, Shi F, Yap P-T, Gilmore J |
You cannot overwrite this file.
File usage
There are no pages that use this file.


