File:Frog ectoderm gene co-expression network.jpg
Original file (3,637 × 3,264 pixels, file size: 2.11 MB, MIME type: image/jpeg)
Summary
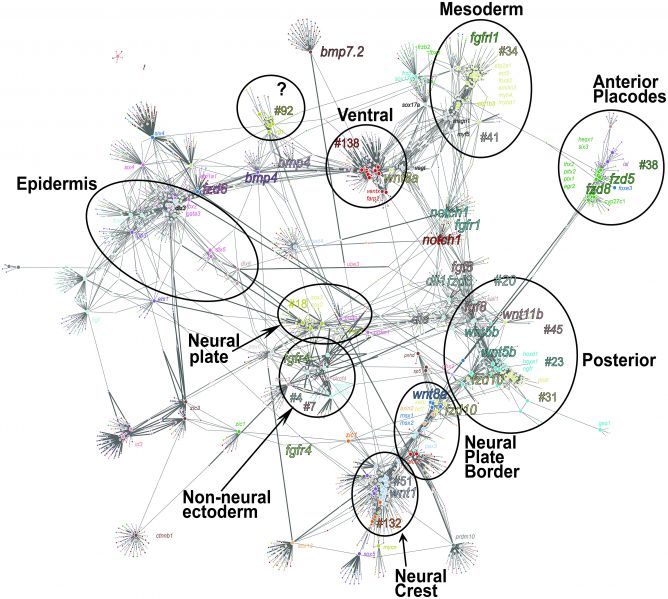
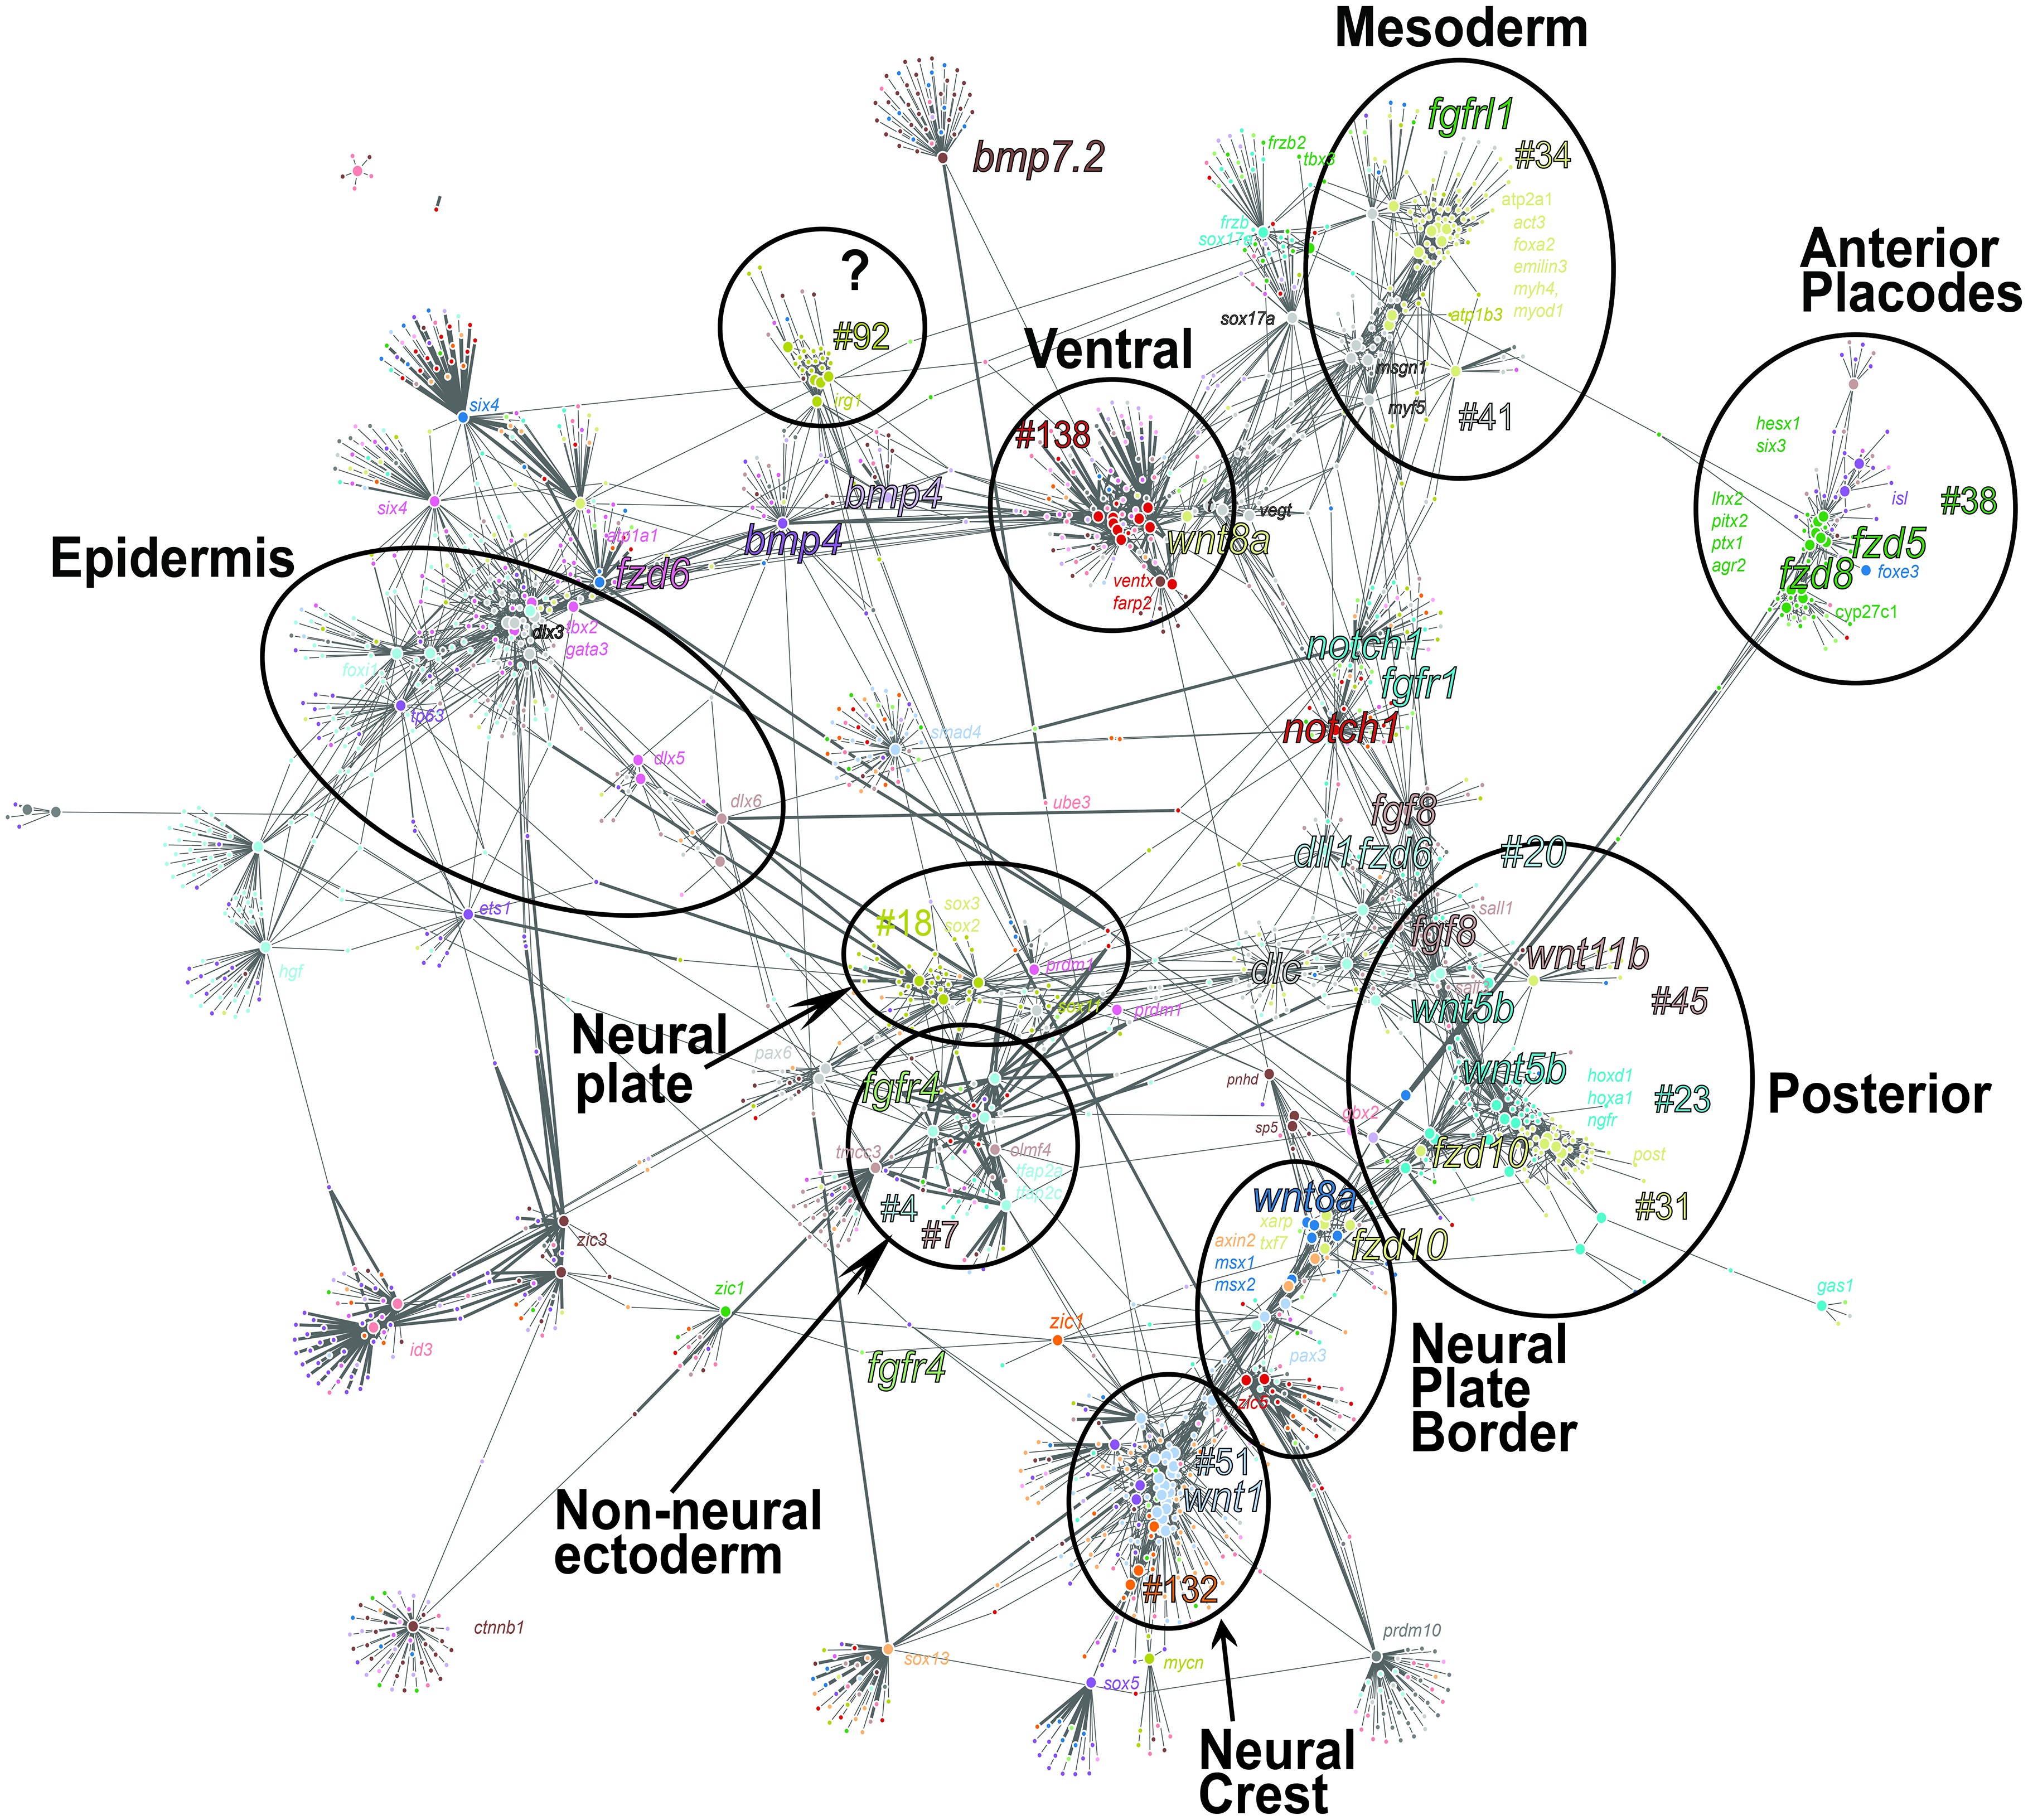
Fig 9. Gene co-expression network of Xenopus neurula visualized biologically meaningful relationships between weighted gene co-expression network analysis (WGCNA) groups and subsets of genes. We obtained a gene co-expression network using a large input gene list, including Wnt-related transcripts, neural, neural crest (NC), placode, and mesoderm genes as input nodes (large points, S10 Table). The p-value cutoff <1E-09 generated 2,001 nodes (small points indicate closely correlated genes; the color of the points refers to a given WGCNA group) and 4,945 edges. Circles are drawn to groups of genes with close spatial/temporal expression patterns. The group was named based on known members of the group. Groups are linked to other groups with positive (thin line) or negative (thick line) correlation. As an example, NC genes (groups #51 and #132) and placodes (group #38, in green) display negative correlation of expression with posterior genes (groups #23, #20, thick lines). The network also indicates interactions between ventral genes such as ventx genes (group #138), positively correlated with bmp4 and bmp7.2 (thin lines). When running the EctoMap application, the network is interactive and indicates each gene name upon selection. https://doi.org/10.1371/journal.pbio.2004045.g009
File history
Yi efo/eka'e gwa ebo wo le nyangagi wuncin ye kamina wunga tinya nan
| Gwalagizhi | Nyangagi | Dimensions | User | Comment | |
|---|---|---|---|---|---|
| current | 20:03, 11 Mayıs 2019 | | 3,637 × 3,264 (2.11 MB) | Z8600021 (talk | contribs) | Fig 9. Gene co-expression network of Xenopus neurula visualized biologically meaningful relationships between weighted gene co-expression network analysis (WGCNA) groups and subsets of genes. We obtained a gene co-expression network using a large input... |
You cannot overwrite this file.
File usage
The following page uses this file: