File:Blood-brain barrier EM01.jpg
Original file (1,656 × 810 pixels, file size: 250 KB, MIME type: image/jpeg)
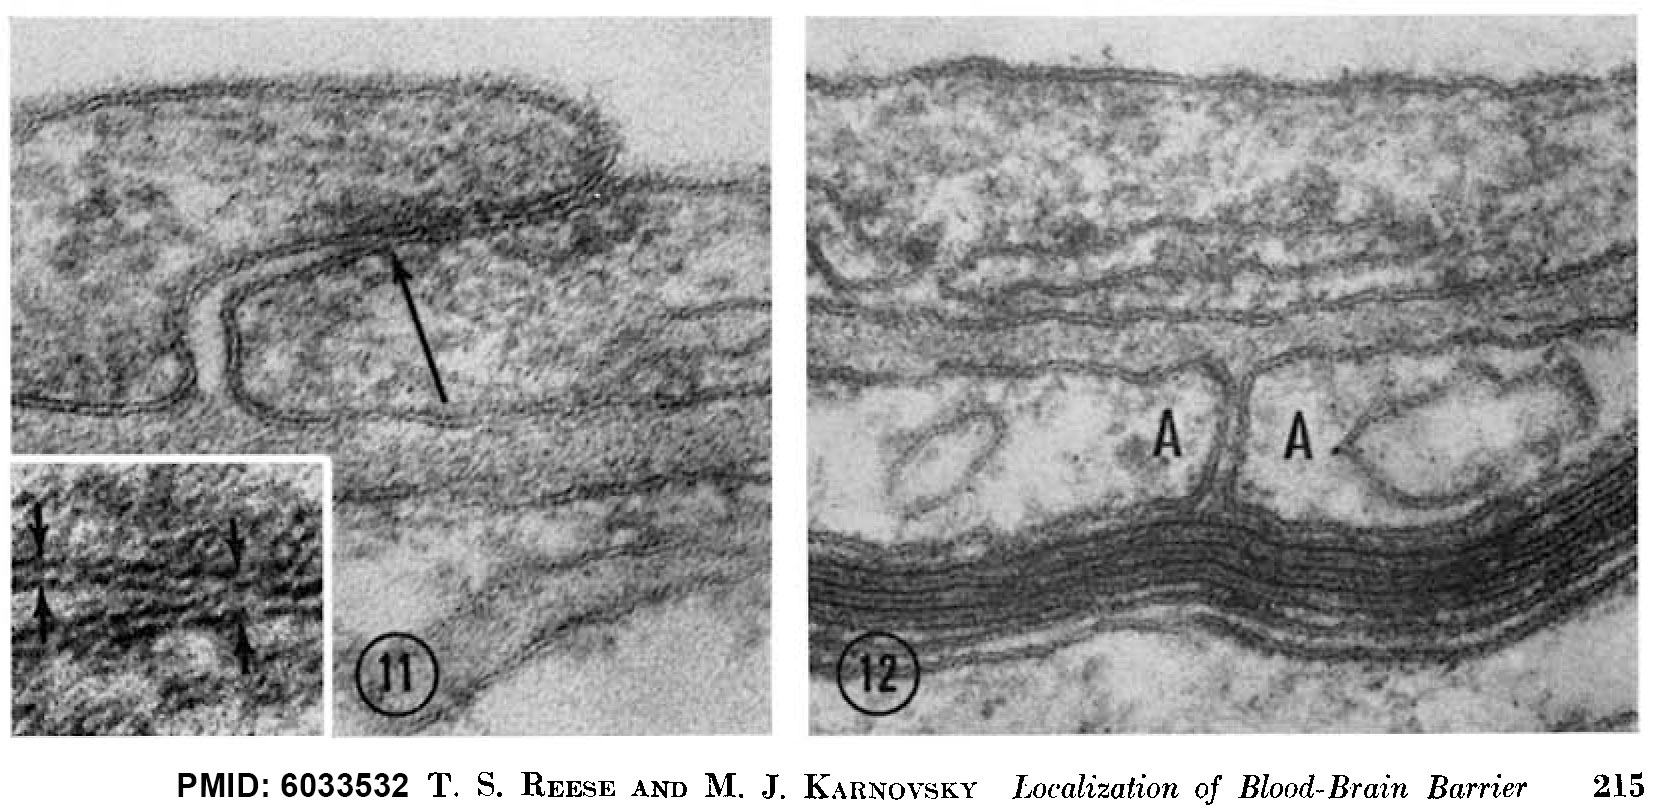
FIGURE 11 Regions of overlap between neighboring endothelial cells, illustrating range of variation in structure of the intercellular cleft. In Fig. 11, the cleft is obliterated by a tight junction (arrow) extending throughout most of its length. The region of the intercellular cleft indicated by the arrow in Fig. 11 is shown in inset at higher magnification to illustrate that the total width of the tight junc- tion (between arrows at right) is less than twice the width of the adjacent plasma mem- brane (between arrows at left). Normal mouse; uranyl acetate block stain. Fig. 11, X 170,000. Fig. 11 inset, X 420,000.
FIGURE 12 Astrocytic end feet (A) lying between a myclinated axon and the basement lamina of the vascular endothelium. A cleft between the astrocytic end feet extends from the basement lamina to a perivascular myelinated axon and appears open except near the blood vessel where it is invaded by some basement lamina material.
Normal mouse; uranyl acetate block stain. X 150,000.
Reference
<pubmed>6033532</pubmed>
Copyright
Rockefeller University Press - Copyright Policy This article is distributed under the terms of an Attribution–Noncommercial–Share Alike–No Mirror Sites license for the first six months after the publication date (see http://www.jcb.org/misc/terms.shtml). After six months it is available under a Creative Commons License (Attribution–Noncommercial–Share Alike 4.0 Unported license, as described at https://creativecommons.org/licenses/by-nc-sa/4.0/ ). (More? Help:Copyright Tutorial)
File history
Yi efo/eka'e gwa ebo wo le nyangagi wuncin ye kamina wunga tinya nan
| Gwalagizhi | Nyangagi | Dimensions | User | Comment | |
|---|---|---|---|---|---|
| current | 11:31, 29 May 2017 | | 1,656 × 810 (250 KB) | Z8600021 (talk | contribs) | |
| 11:30, 29 May 2017 | 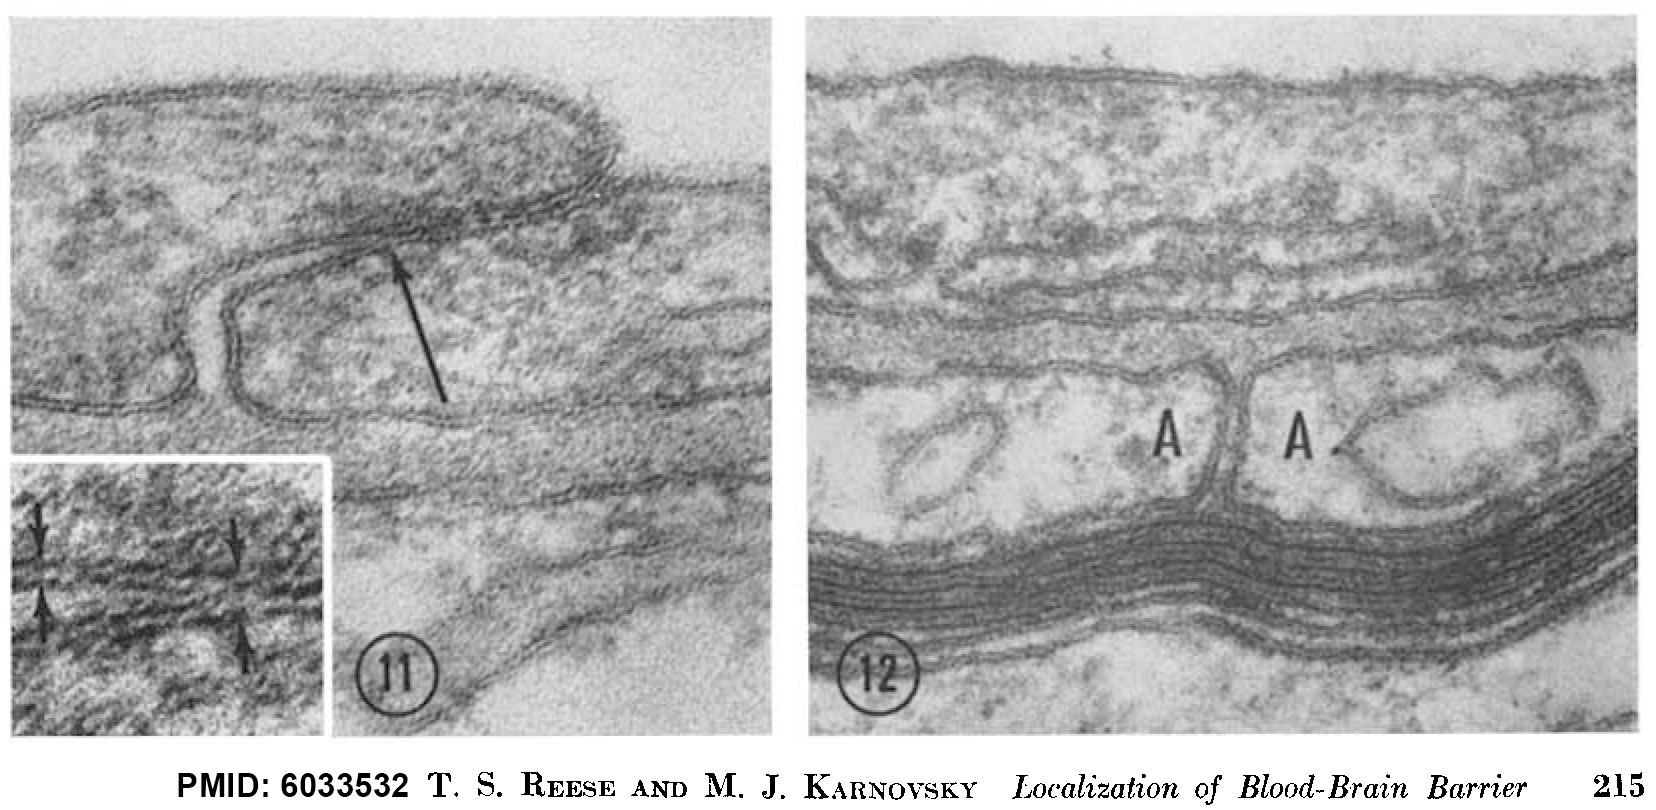 | 1,656 × 810 (223 KB) | Z8600021 (talk | contribs) | FIGURE 11 Regions of overlap between neighboring endothelial cells, illustrating range of variation in structure of the intercellular cleft. In Fig. 11, the cleft is obliterated by a tight junction (arrow) extending throughout most of its length. The... |
You cannot overwrite this file.
File usage
The following page uses this file: