File:Tectum signaling model 01.jpg
Tectum_signaling_model_01.jpg (600 × 314 pixels, file size: 41 KB, MIME type: image/jpeg)
Tectum Development Signaling Model
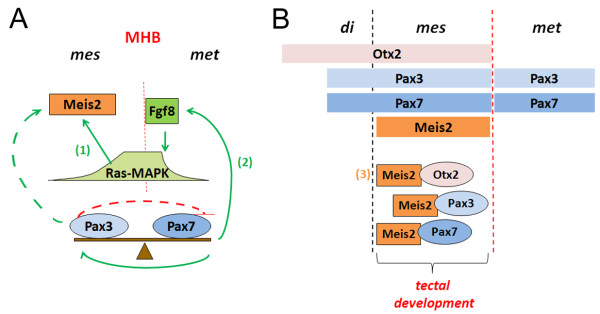
Model for a possible cooperation of Meis2, Pax3, Pax7 and Otx2during tectal development.
Red lines indicate negative regulation, green arrows positive regulation. Dashed lines indicate hypothetical direct regulation of the Meis2 promoter/enhancer by different Pax3 concentrations. Solid lines indicate indirect regulation of Meis2 expression via Pax3/7 mediated induction of Fgf8 as previously reported:
(1) Regulation of Meis2 expression in response to Ras-MAPK signaling levels reported in [19];
(2) Induction of Fgf8 by Pax3 and Pax7 reported in [11];
(3) Existence of Meis2-Otx2 containing protein complexes in the tectal anlage reported in [17].
Reference
<pubmed>22390724</pubmed>| BMC Dev Biol.
© 2012 Agoston et al; licensee BioMed Central Ltd.
This is an Open Access article distributed under the terms of the Creative Commons Attribution License (http://creativecommons.org/licenses/by/2.0), which permits unrestricted use, distribution, and reproduction in any medium, provided the original work is properly cited.
Agoston et al. BMC Developmental Biology 2012 12:10 doi:10.1186/1471-213X-12-10
1471-213X-12-10-6.jpg
File history
Yi efo/eka'e gwa ebo wo le nyangagi wuncin ye kamina wunga tinya nan
| Gwalagizhi | Nyangagi | Dimensions | User | Comment | |
|---|---|---|---|---|---|
| current | 08:50, 11 Haziran 2012 | | 600 × 314 (41 KB) | Z8600021 (talk | contribs) | ==Tectum Development Signaling Model== Model for a possible cooperation of Meis2, Pax3, Pax7 and Otx2during tectal development. Red lines indicate negative regulation, green arrows positive regulation. Dashed lines indicate hypothetical direct regulat |
You cannot overwrite this file.
File usage
The following page uses this file:


