Category:Graph: Difference between revisions
From Embryology
No edit summary |
mNo edit summary |
||
| Line 1: | Line 1: | ||
This | This {{Embryology}} category shows pages and images that relate to graphs and graphical representation of data. If the associated raw data is available it is linked from the file information. | ||
Latest revision as of 23:06, 3 June 2015
This Embryology category shows pages and images that relate to graphs and graphical representation of data. If the associated raw data is available it is linked from the file information.
Pages in category 'Graph'
The following 2 pages are in this category, out of 2 total.
Media in category 'Graph'
The following 151 files are in this category, out of 151 total.
 Abnormal AusData81-92.png 523 × 358; 10 KB
 Adrenal and gonad steroidogenic factor 1 expression.jpg 1,000 × 636; 88 KB
 Anogenital distance from birth to 2 years.jpg 565 × 545; 34 KB
 ART types USA 1996.png 417 × 341; 25 KB
 Aus multiple birth graph.png 541 × 292; 5 KB
 Aus public health activities 2007-08.png 669 × 598; 52 KB
 Australia - insulin-treated diabetes by type 2015.jpg 800 × 774; 59 KB
 Australia and world population growth graph.jpg 1,000 × 566; 97 KB
 Australia Congenital heart disease 2016–17.png 1,296 × 989; 94 KB
 Australia2009 breast cancer graph.jpg 1,043 × 800; 81 KB
 Australian abnormalities 81-92 git.jpg 481 × 344; 43 KB
 Australian abnormalities 81-92 urogenital.jpg 600 × 429; 54 KB
 Australian abnormalities pie urogen.png 481 × 344; 6 KB
 Australian birth delivery method 2007.jpg 617 × 314; 13 KB
 Australian categories perinatal and infant death graph.jpg 800 × 298; 43 KB
 Australian trends diabetes prevalence 19990-2008.jpg 767 × 518; 42 KB
 Australian-births 2007.png 500 × 500; 7 KB
 Australian-births 2011.jpg 800 × 648; 35 KB
 Average length of the mouse embryo.JPG 629 × 369; 23 KB
 Average Luteal Progesterone by Age at UK Migration.jpg 600 × 367; 25 KB
 Average Luteal Progesterone Profiles by Group.jpg 600 × 387; 31 KB
 Bovine estrous cycle hormone graph.jpg 1,000 × 683; 76 KB
 Brain growth and birth size.jpg 800 × 492; 70 KB
 Carnegie stages species comparison.jpg 800 × 514; 85 KB
 Causes of neonatal death globally 2000.jpg 600 × 427; 135 KB
 CDC Congenital abnormality graph.jpg 800 × 498; 73 KB
 CDC-XX length birth to 3 years.png 684 × 927; 75 KB
 CDC-XY length birth to 3 years.png 691 × 933; 77 KB
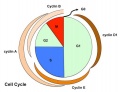 Cell cycle1.jpg 601 × 460; 23 KB
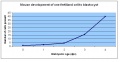 Chart of mouse development 1.JPG 663 × 343; 32 KB
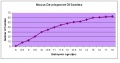 Chart of mouse development 2.JPG 663 × 347; 31 KB
 Childhood adrenocortical tumours graph.jpg 600 × 769; 38 KB
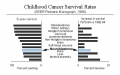 Childhood cancer survival rates.jpg 536 × 335; 25 KB
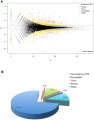 Differentially expressed RefSeq genes in human trisomy 21.jpg 661 × 847; 171 KB
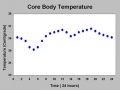 Diurnal body temperature.jpg 400 × 300; 15 KB
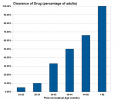 Drug-clearance-rates.png 652 × 542; 14 KB
 Drugs- Area under plasma concentration time curve.jpg 593 × 558; 28 KB
 Ectopic Pregnancies- United-States 1970-1992.jpg 800 × 543; 60 KB
 Ectopic Pregnancies- United-States 1997-2006.jpg 800 × 332; 19 KB
 Fetal cells maternal blood graph.jpg 600 × 426; 18 KB
 Fetal head growth circumference graph01.jpg 905 × 613; 58 KB
 Fetal head growth circumference graph02.jpg 800 × 650; 44 KB
 Fetal length change.jpg 972 × 648; 72 KB
 Fetal liver weight growth graph.jpg 800 × 521; 34 KB
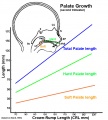 Fetal palate growth graph.jpg 681 × 757; 77 KB
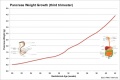 Fetal pancreas weight growth graph.jpg 1,000 × 669; 49 KB
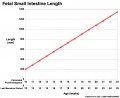 Fetal small Intestine length growth graph.jpg 800 × 653; 51 KB
 Fetal thymus weight growth graph.jpg 1,000 × 669; 52 KB
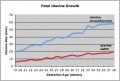 Fetal uterus growth.jpg 438 × 296; 28 KB
 File-Scotland - spontaneous births 1980-2004.jpg 600 × 259; 32 KB
 Gastroschisis birth weight graph.jpg 600 × 462; 25 KB
 Germany fertility rate graph.jpg 600 × 519; 37 KB
 Gestational age distribution NIPT.jpg 671 × 493; 41 KB
 Graph- Apgar score and cerebral palsy.jpg 600 × 366; 36 KB
 Growth curve for boys with Trisomy 21 (Down syndrome).jpg 800 × 772; 52 KB
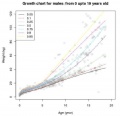
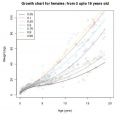 Growth curve for girls with Trisomy 21 (Down syndrome).jpg 800 × 759; 50 KB
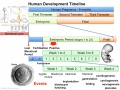 Human development timeline graph 01.jpg 1,000 × 750; 141 KB
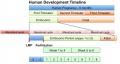 Human development timeline graph 02.jpg 800 × 424; 61 KB
 Human male anogenital distance graph.jpg 600 × 429; 28 KB
 Human ovary non-growing follicle model.jpg 1,151 × 679; 116 KB
 Human ovary postnatal growth.jpg 800 × 467; 40 KB
 Human thyroid system and neural development.jpg 1,032 × 728; 132 KB
 Hyperthermia and hypothermia.jpg 896 × 247; 58 KB
 IBook sales may 2013.jpg 800 × 336; 24 KB
 Implantation predictive value of euploid screening results.jpeg 780 × 598; 74 KB
 India sex ratio graph.jpg 800 × 528; 63 KB
 IVF cycles ANZ 1999-2004.jpg 585 × 372; 33 KB
 Keibel Mall 145.jpg 716 × 920; 84 KB
 Keibel Mall 146.jpg 736 × 1,000; 96 KB
 Keibel Mall 147.jpg 1,117 × 851; 157 KB
 Keibel Mall 148.jpg 604 × 909; 93 KB
 Malaria global limits 2007.jpg 1,000 × 387; 80 KB
 Male puberty testicular volume graph.jpg 1,140 × 826; 126 KB
 Male testosterone and AMH level graph.jpg 683 × 360; 31 KB
 Mean maternal age term or preterm birth.jpg 600 × 393; 22 KB
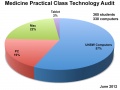 Med computer audit June 2012.jpg 800 × 600; 46 KB
 Menstrual cycle.jpg 534 × 383; 47 KB
 Menstrual cycle.png 1,000 × 750; 122 KB
 Mouse carbon monoxide exposure 01.jpg 600 × 840; 50 KB
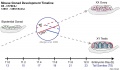 Mouse gonad development timeline.jpg 1,200 × 697; 98 KB
 Mouse hematopoietic stem cell.gif 600 × 595; 40 KB
 Mouse ovarian follicle size.jpg 600 × 407; 36 KB
 Muscle- C2C12 differentiation.jpg 600 × 889; 101 KB
 Neural tube defects sex ratio graph 01.png 2,220 × 740; 406 KB
 Newborn- cryptorchidism normal birthweight.jpg 800 × 428; 47 KB
 Non-syndrome abnormalities USA 1998-2008 graph.jpg 770 × 502; 40 KB
 Normal distribution curve.jpg 720 × 460; 52 KB
 NSW perinatal mortality rate.png 800 × 600; 6 KB
 NSW-pertussis-notification-graph 2012-16.jpg 700 × 658; 71 KB
 Ovary follicle size graph.jpg 1,057 × 820; 102 KB
 Ovary oocyte size graph.jpg 1,057 × 820; 114 KB
 PAHO Countries reporting measles and rubella 2013-2014.png 1,351 × 864; 56 KB
 Perinatal mortality rate NSW 1992-2002.png 800 × 600; 6 KB
 Placenta gene expression.jpg 925 × 694; 346 KB
 Placental cord blood banks 2009.jpg 800 × 382; 31 KB
 Placental volume graph.jpg 800 × 628; 54 KB
 Postnatal alveoli number.jpg 800 × 504; 26 KB
 Postnatal free T4 levels graph.jpg 819 × 628; 33 KB
 Postnatal thyrotropin levels graph.jpg 852 × 729; 35 KB
 Preterm fetal-infant growth chart.jpg 1,000 × 1,361; 267 KB
 Puberty growth.jpg 528 × 511; 36 KB
 Rat thyroid system and neural development.jpg 1,032 × 740; 127 KB
 Rubella and measles elimination in the Americas.jpg 995 × 790; 160 KB
 Rugh 016.jpg 1,200 × 755; 118 KB
 Site edits May-Jul 2019 graph.jpg 1,490 × 477; 68 KB
 Special educational need by gestational age.jpg 600 × 443; 19 KB
 Spleen size in children and adults.jpg 1,280 × 866; 111 KB
 Spontaneous births.jpg 1,000 × 431; 63 KB
 Stockard Papanicolaou1917 figA.jpg 1,382 × 1,000; 143 KB
 Streeter1957 fig01.jpg 1,292 × 1,500; 218 KB
 Syndrome abnormalities USA 1998-2008 graph.jpg 572 × 513; 36 KB
 Teen pregnancy USA.png 532 × 339; 7 KB
 Testicular volume graph.jpg 554 × 405; 57 KB
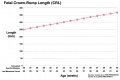 Third trimester Crown-Rump Length graph.jpg 972 × 648; 59 KB
 Trisomy 21 - nuchal translucency graph 01.jpg 638 × 1,000; 69 KB
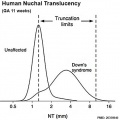 Trisomy 21 - nuchal translucency graph 02.jpg 500 × 498; 30 KB
 Trisomy21 graph.jpg 600 × 463; 36 KB
 UK deaths from cystic fibrosis.jpg 800 × 523; 44 KB
 USA antenatal steriod and surfactant treatment 2006.jpg 500 × 410; 37 KB
 USA ART live birth rates 1996.jpg 466 × 324; 22 KB
 USA assisted reproductive technology 1996.jpg 417 × 341; 25 KB
 USA birth location 1990-2006.jpg 600 × 415; 40 KB
 USA Births 1920-2013 preliminary 2014.jpg 1,179 × 776; 143 KB
 USA Births 1920-2013.jpg 1,200 × 681; 94 KB
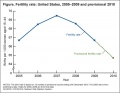 USA births fertility 2010.jpg 800 × 617; 54 KB
 USA cesarean rate by gestational age.jpg 498 × 481; 39 KB
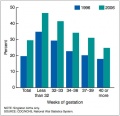
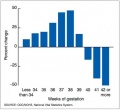 USA change distribution births by gestational age.jpg 499 × 457; 18 KB
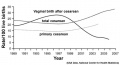 USA data - Vaginal birth after cesarean.jpg 627 × 338; 29 KB
 USA Infant mortality rates 1995 and 2000.jpg 600 × 360; 39 KB
 USA live births and fertility rates.jpg 600 × 600; 67 KB
 USA Mean age mother first birth by state.jpg 800 × 592; 45 KB
 USA Measles cases and outbreaks graph 01.jpg 616 × 616; 58 KB
 USA out-of-hospital births 1990-2006.jpg 600 × 438; 41 KB
 USA percentage low birthweight by maternal age.jpg 498 × 478; 46 KB
 USA pregnancy by age 2000 and 2005.jpg 600 × 517; 59 KB
 USA rubella and congenital rubella syndrome cases.jpg 800 × 427; 44 KB
 USA triplet birth rate.jpg 502 × 515; 50 KB
 USA- ART clinics 2006.jpg 641 × 447; 63 KB
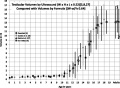
 WHO Report 2007 - Global tuberculosis new cases 2007.jpg 600 × 379; 26 KB
 WHO-XX length birth to 2 years.png 1,136 × 805; 57 KB
 WHO-XY length birth to 2 years.png 1,136 × 803; 57 KB
 Wikiviewstats2015.jpg 1,022 × 746; 81 KB
 World fertility graph01.jpg 946 × 957; 154 KB
 World infant mortality 01.jpg 1,068 × 979; 147 KB
 World population graph01.jpg 807 × 782; 173 KB
 World population graph02.jpg 722 × 655; 70 KB
 World population graph03.jpg 1,000 × 581; 37 KB
- Error creating thumbnail: File with dimensions greater than 12.5 MPWorm - embryonic cell lineage 01.jpg 10,389 × 1,336; 598 KB
 Worm - embryonic cell lineage 02.jpg 1,000 × 129; 19 KB
 Yolk sac and amniotic cavity volume graph.jpg 719 × 1,000; 50 KB


.jpg)
.jpg)


